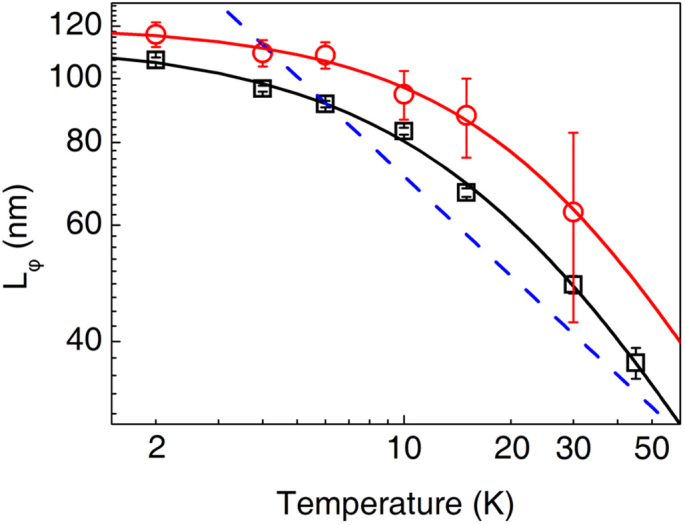
Figure 4. Temperature dependence of  obtained from the WAL (square) and UCF data (circle).

The big error of  at 30 K from UCF is due to nearly disappearance of the UCF. The solid curve shows the fitting of the experimental data according to the scaling formula (2) with p' = 1 and p = 2. The dashed line is the e-e interaction fitting.
