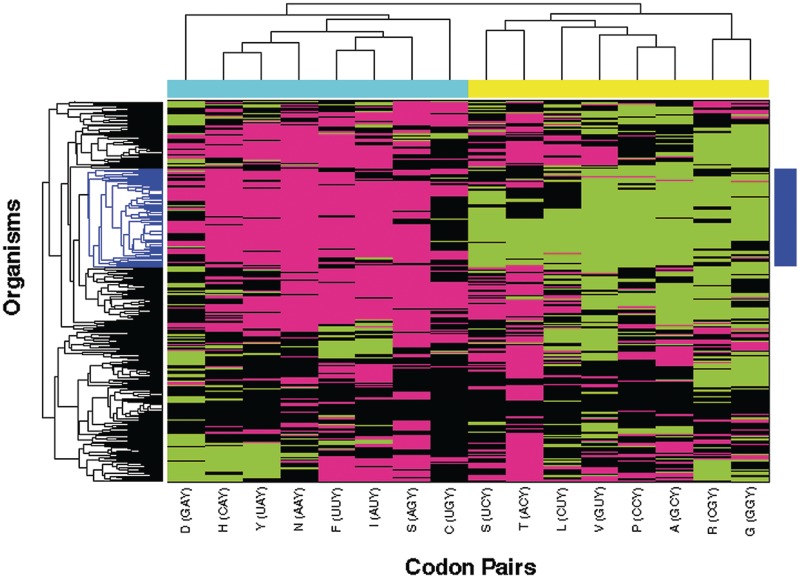
Figure 1.
An association between the degeneracy level of amino acids and codon bias pattern in N1N2Y3 codon-pairs. The matrix of codon-pair biases in multiple organisms (Green: U-Bias, magenta: C-Bias, black: N-Bias) was clustered using a hamming distance metric. The clustering reveals a clear distinction between codon-pairs belonging to codon families with four-fold degeneracy (yellow bar) and those belonging to two- and three-fold degenerate families (cyan bar), where the former are statistically significantly biased towards the U-ending codon and the latter are statistically significantly biased towards the C-ending codon. This distinction is most pronounced in a subset of organisms (blue bar).

