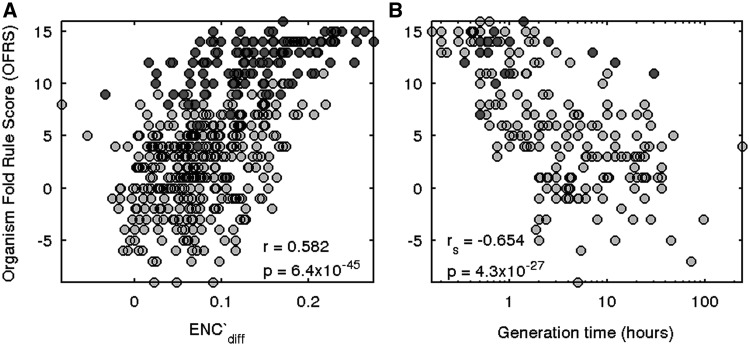
Figure 2.
Organisms conforming to the fold rule demonstrate strong translational selection and fast growth. OFRS and ENC′diff were calculated as described in ‘Materials and Methods’ section and minimal generation times were taken from (46). (A) Association between OFRS and ENC′diff was evaluated by computing Pearson correlation coefficient. (B) Association between OFRS and minimal generation time was evaluated by computing Spearman correlation coefficient (since the generation time variable is not normally distributed). Organisms most compatible with the fold rule (marked by the blue bar in Figure 1) are colored dark gray and have relatively high ENC′diff and low minimal generation time values.

