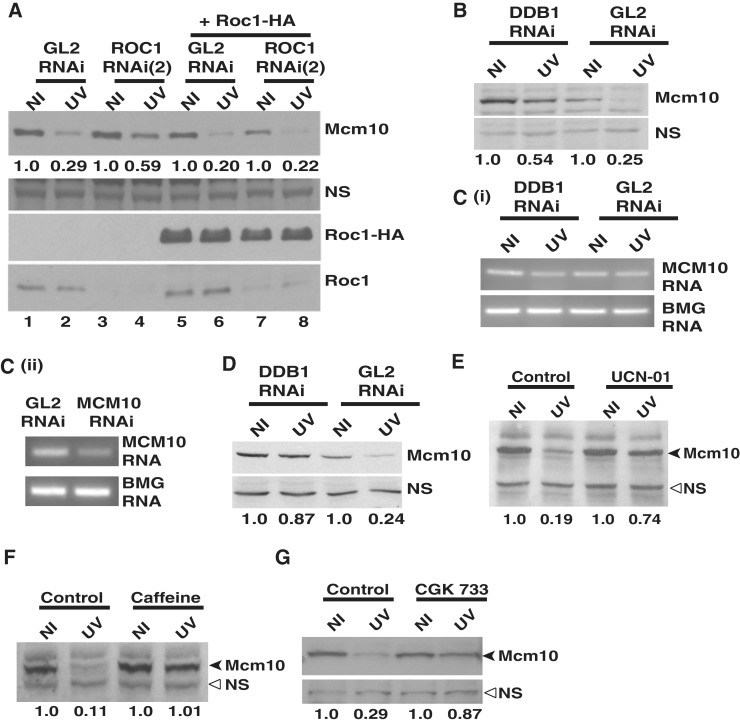
Figure 4.
DDB1-dependent E3 ubiquitin ligase does not regulate the stability of Mcm10 by altering its mRNA levels. (A) Overexpression of siRNA-resistant Roc1 reverses the suppression of UV-triggered Mcm10 degradation following Roc1 depletion. HeLa cells were transfected on three consecutive days with either GL2 or ROC1 siRNA (2) along with plasmid expressing HA-tagged Roc1 as indicated. 24 h after the last transfection, the cells were exposed to UV, harvested 4 h later and Mcm10 levels were analyzed. The numbers in panel (A) indicate the levels of Mcm10 protein in UV-irradiated cells relative to non-irradiated cells after specific siRNA and plasmid transfection. The expression of HA-tagged Roc1 (third panel) and decrease in the levels of endogenous Roc1 (last panel) was confirmed by immunoblotting. (B) and (C) HeLa cells were transfected with DDB1 siRNA, and the levels of Mcm10 mRNA and protein were analyzed 4 h after UV irradiation. The numbers indicate the levels of Mcm10 protein (B) in UV-irradiated cells relative to non-irradiated cells after GL2 or DDB1 siRNA transfection. Panel C (ii) displays that under similar PCR amplification conditions, reduced levels of Mcm10 mRNA can be detected after RNAi indicating that the PCR amplification was at non-saturating levels. (D) HeLa cells were transfected with DDB1 siRNA, and the stability of Mcm10 was analyzed 2 h after UV irradiation. The numbers indicate the levels of Mcm10 protein in UV-irradiated (UV) cells relative to non-irradiated (NI) cells after GL2 or DDB1 siRNA transfection. (E–G) UV-triggered Mcm10 degradation is blocked in the presence of UCN-01, CGK 733 and caffeine. Cells were treated with 300 nM UCN-01, 25 mM caffeine or 10 µM CGK 733 for 4 h followed by UV exposure, and the cells were harvested 2 h later for analysis of Mcm10 protein. The numbers in panels (E), (F) and (G) indicate the levels of Mcm10 protein in UV-irradiated cells relative to non-irradiated cells after specific treatment. NS points to a non-specific band that displays equal protein loading in different lanes while β-2 microglobulin (BMG) serves as the internal RNA loading control.

