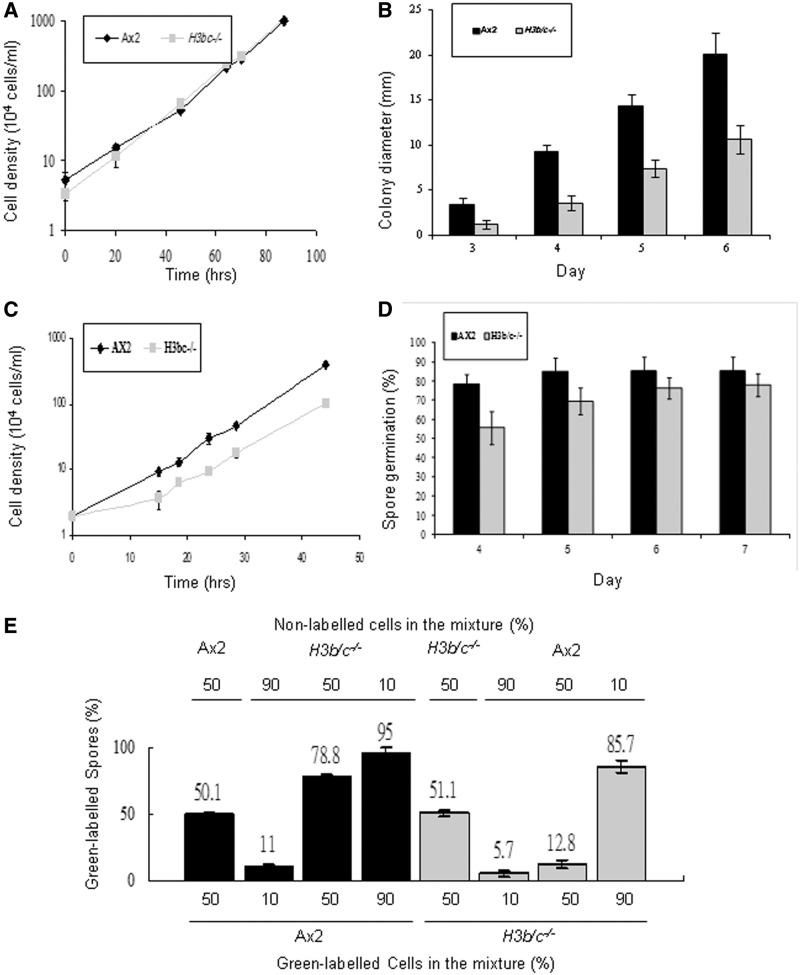
Figure 5.
Dictyostelium H3b/c−/− cells show growth and developmental defects. (A) Axenic growth. Ax2 and H3b/c−/− cells were diluted to a density of 4 × 10⁴ cells/ml and grown in shaken suspension in HL5 media at 22°C and cell numbers were determined at the indicated intervals. Values are mean ± SD (n = 4). (B) Exponentially growing Ax2 and H3b/c−/− cells were diluted and plated at low density on SM agar plates in association with Klebsiella aerogenes (Ka). Diameter of colonies derived from single cells was measured every day from the third to the sixth day. More than 30 random colonies were measured in each experiment and mean values of three independent experiments are shown ± SD. (C) Ax2 and H3b/c−/− cells were diluted to a density of 2 × 10⁴ cells/ml and grown in shaking suspension in association with heat killed Ka (109 Ka/ml) at 22°C and cell numbers were determined at the indicated intervals. Values are mean ± SD (n = 4). (D) Three hundred Ax2 and H3b/c−/− spores were isolated from 2-day-old fruiting bodies and plated on a Ka lawn on SM agar plates. The number of visible colonies was counted each day for up to 7 days. Results are expressed as the percentage of spores plated. Values are mean ± SD (n = 3). (E) Exponentially growing Ax2 or H3b/c−/− cells were labeled with Green Cell Tracker Dye and mixed with unlabelled cells of the other genotype in the percentages indicated and the mixtures developed on Millipore filters on an LPS soaked pad for 48 h. In each case over 2000 spores were counted and the percentage of labelled spores is shown. In all cases the experiments were performed labelling the wild-type cells mixed with unlabelled H3b/c−/− cells and with labelled H3b/c−/− cells mixed with unlabelled parental cells to ensure there was no bias due to the labelling procedure. Controls were carried out in which labelled cells were mixed with unlabelled cells of the same genotype to confirm that the dye loading did not bias cell fate. Values are mean ± SD (n = 4).

