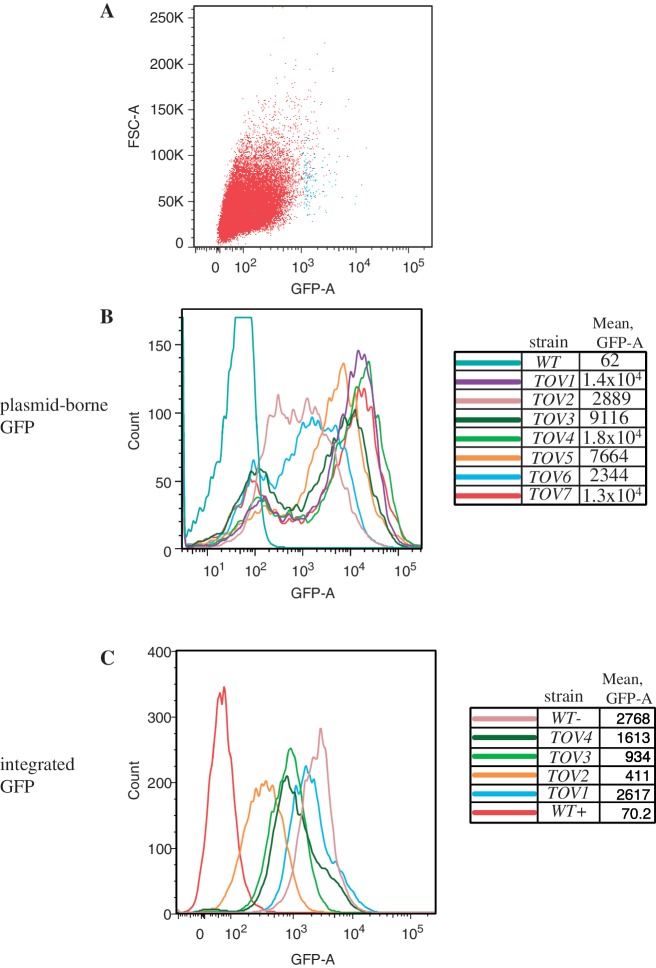
Figure 2.
Flow cytometry analysis of candidate yeast mutants expressing GFP from a reporter. (A) Plot of forward scatter area (particles) versus GFP fluorescence area for yeast strain DY1514, the parent strain to the tov mutants, prior to sorting (red, 50 000 cells) and post-sorting (blue, 150 cells). (B) Particle count versus GFP area is plotted for yeast strains designated tov1 through tov7 bearing the GAL-IT-GFP reporter plasmid. Flow cytometry was independently performed on 10 000 cells each of the wild-type and tov strains at an excitation wavelength of 488 nm using a LSRII (Becton–Dickson) digital analyzer. Bimodality results from plasmid loss (see text). (C) Particle count versus GFP area intensity plot for wild-type and tov1 through tov4 in which a copy of the GAL-IT-GFP reporter transcription unit was integrated. Quantification of the fluorescence of 10 000 cells from each strain was plotted as in part B. The wild-type cells with an integrated GFP reporter that contained (WT+) or lacked (WT−) the IT were also analyzed as negative and positive controls for GFP expression, respectively.

