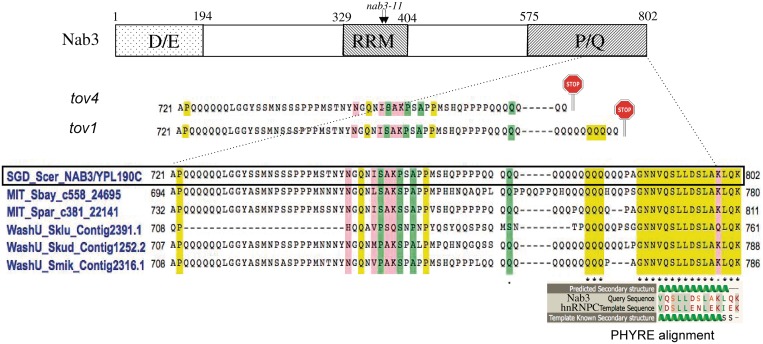
Figure 7.
Map of Nab3 with expansion of the carboxy-terminal sequence and its alignments. A schematic map (not to scale) of the domains of S. cerevisiae Nab3 is shown at the top with the approximate positions of the D/E- and P/Q-rich regions. The RRM piece analyzed by X-ray crystallography (10) is delineated as are the positions of the missense changes in the nab3-11 mutant. A CLUSTALW alignment of the indicated regions of Nab3 from S. cerevisiae (boxed), S. bayanus, S. paradoxus, S. kluyveri, S. kudriavzevii and S. mikatae, is shown in the centre (43,44). Shading designates identities (yellow), strong similarities (pink) and weak similarities (green). The positions of nonsense mutations (stop signs) for the tov1 and tov4 isolates are shown above the alignment. The structural homology alignment generated by the PHYRE algorithm is shown for the known structure of a portion of hnRNP C (template) and the Nab3 tail (query).

