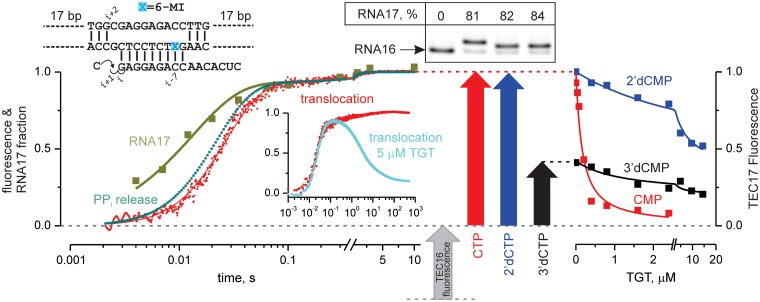
Figure 3.
Kinetic and equilibrium analyses of translocation following CMP incorporation. Top: The initial TEC schematic. Left: Time-resolved measurements of RNA extension by a single CMP nucleotide (olive), release of the reaction by-product PPi (dark teal; simulated as described in Supplementary Figure S3), and translocation of the RNA–DNA hybrid within the RNAP main channel (red). Inset: Translocation curves measured over a 10-min interval in the absence (red) and presence (cyan) of 5 µM TGT. Center: Denaturing polyacrylamide gel of TEC RNAs and fluorescence levels of initial (gray), and CMP (red)-, 2′-dCMP (blue)- and 3′-dCMP (black)-extended TECs. Here and in all subsequent figures, fluorescence levels were normalized as described in Supplementary Methods. Note the faster electrophoretic mobility of 2′- and 3′-dCMP-extended RNAs. Right: Titration of extended TECs with TGT.

