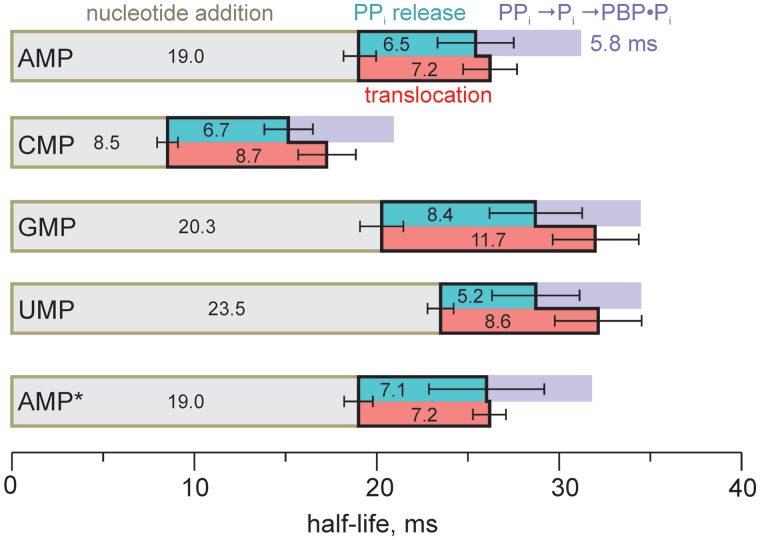
Figure 4.
Contributions of the individual steps to the overall transcription rate. The half-lives of nucleotide addition, PPi release and translocation reactions are depicted as olive, turquoise and red bars, respectively. Purple bars depict the combined half-life of PPi hydrolysis into Pi and Pi binding to MDCC-PBP (Supplementary Figure S3), which accounted for the 5.8-ms delay in the fluorescence signal in PPi release measurements. Error bars are SDs of two to three independent experiments. AMP, CMP, GMP and UMP data were obtained with i − 7 6-MI TECs; AMP* data were obtained with i + 2 2-AP TEC (Supplementary Figure S2).

