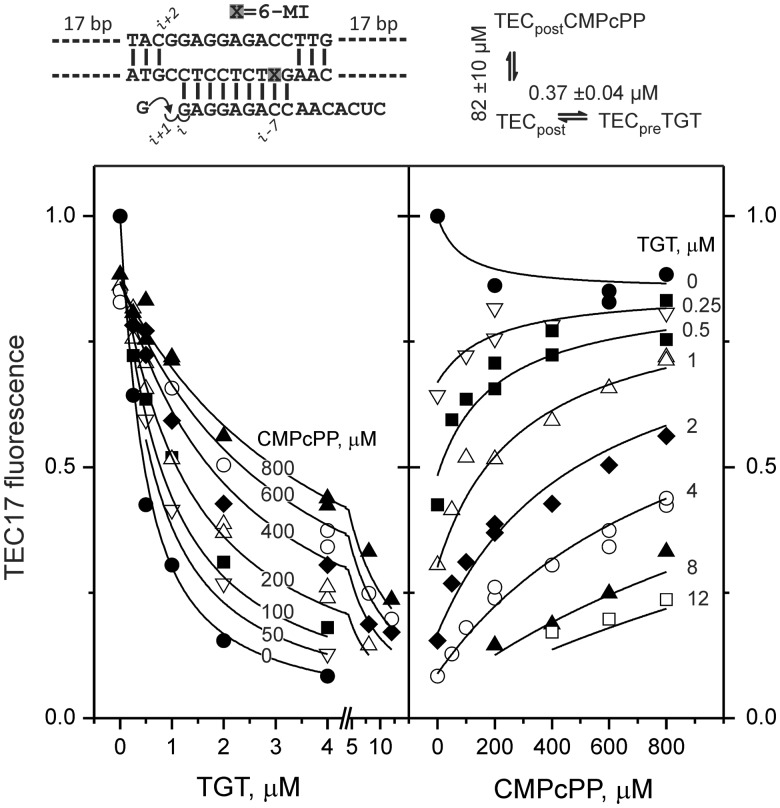
Figure 6.
Normalized fluorescence of GMP-extended TEC as a function of TGT and CMPcPP concentrations. A schematic of the initial scaffold and kinetic model used for global analysis of titration data is indicated above the graph. Reaction species in the model are abbreviated as follows: TECpost, post-translocated TEC17; TECpreTGT, pre-translocated TEC17 with bound TGT; TECpostCMPcPP, post-translocated TEC17 with bound CMPcPP. CMPcPP and TGT dissociation constants are indicated. The best-fit value of the TGT dissociation constant is 2-fold higher than the value for GMP-extended TEC reported in Table 1 due to the use of a different batch of TGT.

