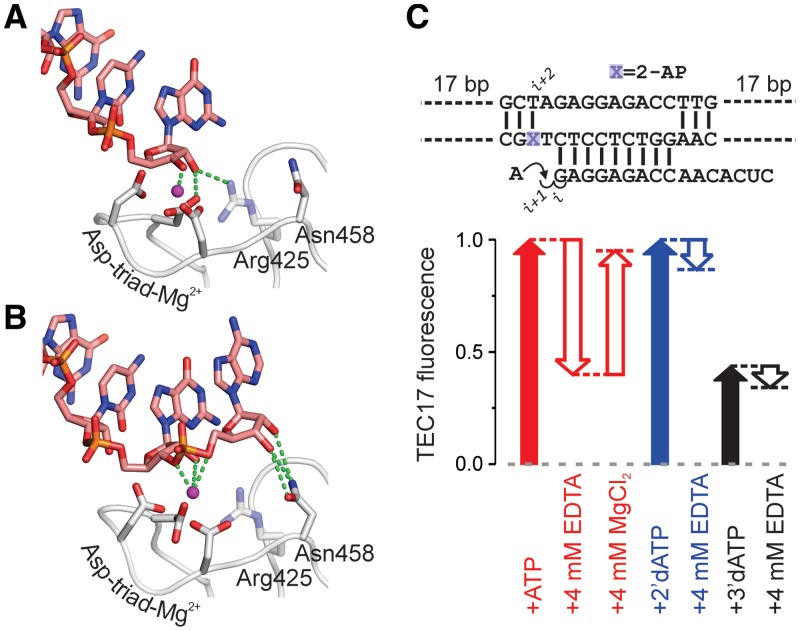
Figure 7.
RNA–protein contacts (green dashed lines) specific for the post- and pre-translocated states. The active site Mg2+ ion is depicted as a magenta sphere. Residue numbers correspond to E. coli RNAP. (A) The post-translocated state (PDB 2O5I). (B) The pre-translocated state model, generated as described in Supplementary Figure S4A. (C) The effects of Mg2+ withdrawal on translocation equilibrium in TECs extended with AMP, 2′ dAMP and 3′ dAMP. A schematic of the initial scaffold is indicated above the graph. The initial concentration of Mg2+ in the assay medium was 2 mM.

