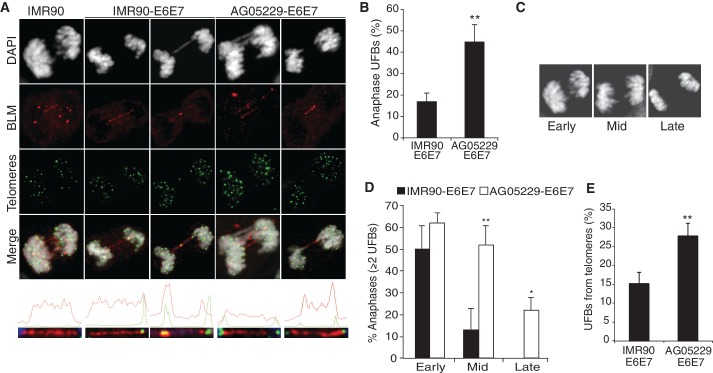
Figure 3.
Ultra-fine bridges (UFBs) are more frequent and persist longer in WS fibroblasts. (A) IF-FISH images of UFB-positive anaphases representing UFBs that do not localize with telomeric foci (left panel), UFBs that colocalize with a telomeric foci at one end or at the center (second and third panels) and UFBs that colocalize with telomeres at both ends (final two panels). Graphs illustrating the signal intensities generated by the profile function of the AxioVision software are shown below each anaphase. (B) The percentage of anaphases with at least one UFB and (C) DAPI-stained anaphases representing three stages of anaphase, determined by distance (in µm) between dividing cells: early, mid and late anaphases. (D) Percentage of UFB-positive anaphases with multiple UFBs per anaphase. Data from IMR90-E6E7 and AG05229-E6E7 cells were grouped according to progress through anaphase (panel C). At least 25 anaphases were analyzed for each cell line per experiment, from four independent experiments. Arrow bars show standard deviation, and P-values were calculated by a Student’s t-test (*P < 0.05 and **P < 0.005). (E) The percentage of UFBs extending from telomeres (T-UFBs). The values were calculated from four independent IF-FISH experiments, where at least 30 anaphases were analyzed from each cell line.

