Figure 4.
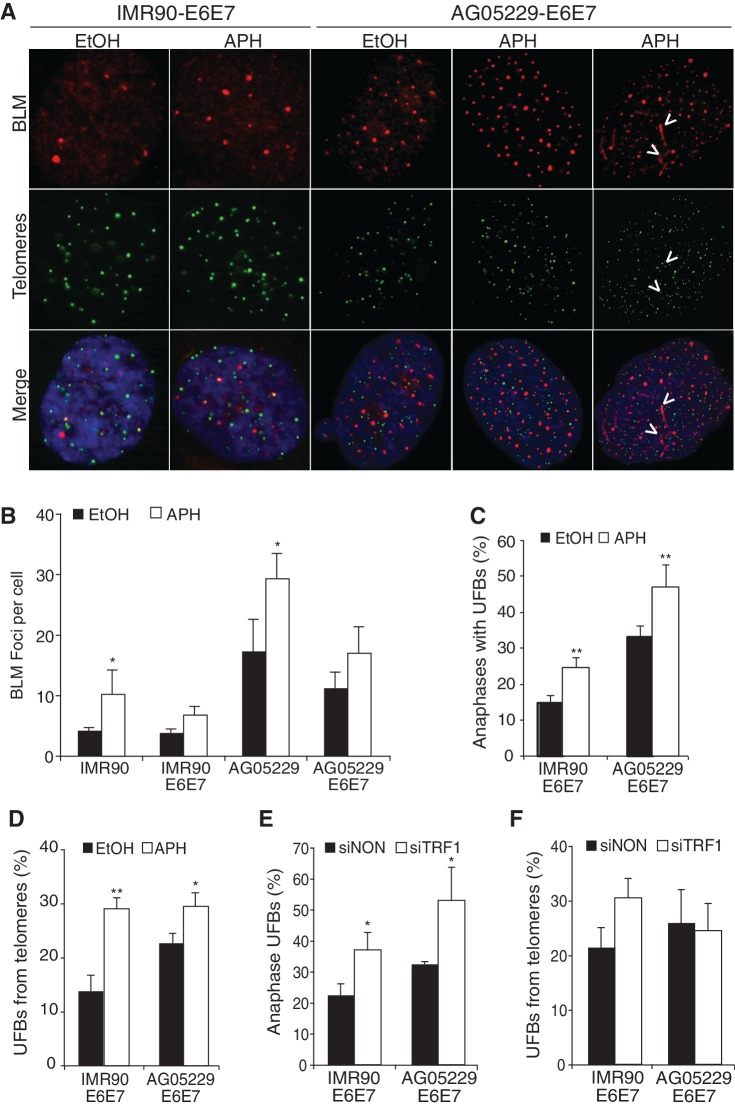
Replication challenge increases UFB formation. (A) IF-FISH images from IMR90-E6E7 and AG05229-E6E7 fibroblast cells. Arrows indicate colocalization events at BLM bridges observed in interphase cells. (B) Average number of BLM foci per cell. At least 100 cells were counted per condition from three independent experiments. (C) Percentage UFB-positive anaphases and (D) percentage of UFBs extending from telomeres (T-UFBs) in IMR90-E6E7 and AG05229-E6E7 cells treated with ethanol or aphidicolin. At least 30 anaphases were counted per condition from three independent experiments. (E) Percentage of UFBs and (F) UFBs that extend from telomeric foci (T-UFBs) on TRF1 suppression. At least 35 anaphases were counted per cell line from two independent experiments. Arrow bars show standard deviation, and P-values were calculated from a Student’s t-test (*P < 0.05 and **P < 0.005).

