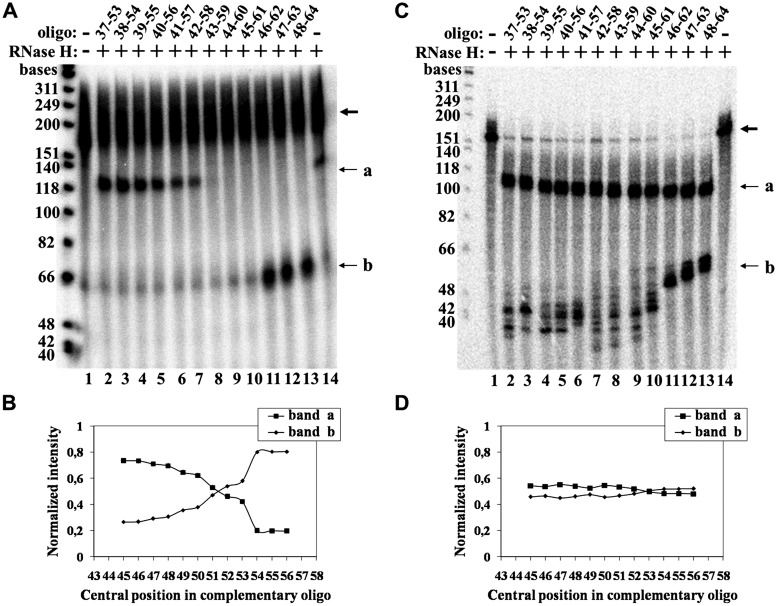
Figure 5.
High resolution mapping of the cross-link between the primer S-5 6-mer and TER. (A) Mapping of the cross-link of the primer S-5 6-mer was performed as illustrated in Figure 3B. The bold arrow indicates the uncleaved primer DNA–TER molecules. a and b denote the bands containing the series of fragments produced by cleavage of the hybrids formed with each complementary oligo. Lane 1: no RNase H, no complementary oligo. Lane 2: oligo complementary to the region of TER spanned by the nucleotides 37–53. Lane 3: oligo complementary to the region of TER spanned by the nucleotides 38–54. Lanes 4–13: overlapping complementary oligos of the same series: 39–55, … ,48–64. Lane 14: no oligo. (B) A plot of the data shown in A. (C) RNase H cleavage assays of hybrids formed between the same overlapping oligos and uniformly labeled TER molecules synthesized in vitro. (D) A plot of the data shown in C. The plotted intensity of band b is the sum of the radioactivities found in all the bands included in the b region of the gel.

