
Figure 5.
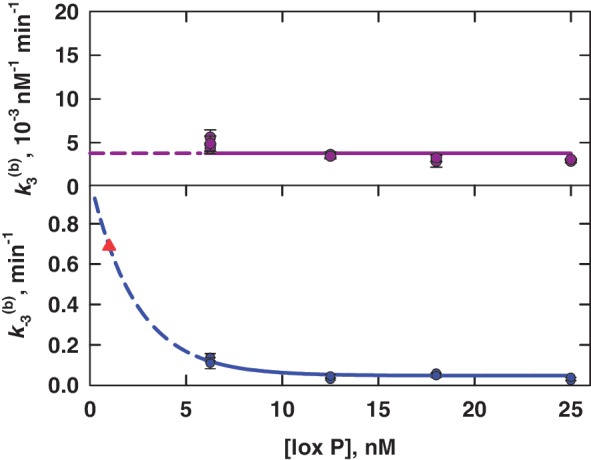
Apparent rate constants for bimolecular synapsis,  , (upper panel) and synaptic-complex dissociation,
  (lower panel) as functions of loxP concentration. Each data point is the average of at least three independent measurements and the error bars indicate the standard error. The horizontal line in the upper panel gives the overall average of
  for all values of [loxP] studied; the curve in the lower panel is the fit of an exponential function to the data for
  . Dashed curves are extrapolations of the [loxP] dependence to zero substrate concentration. The value of
  at [loxP] = 1 nM is 0.69 min−1 and is indicated by the red filled triangle; this is the value of the rate constant used to calculate J under the conditions of intramolecular recombination.