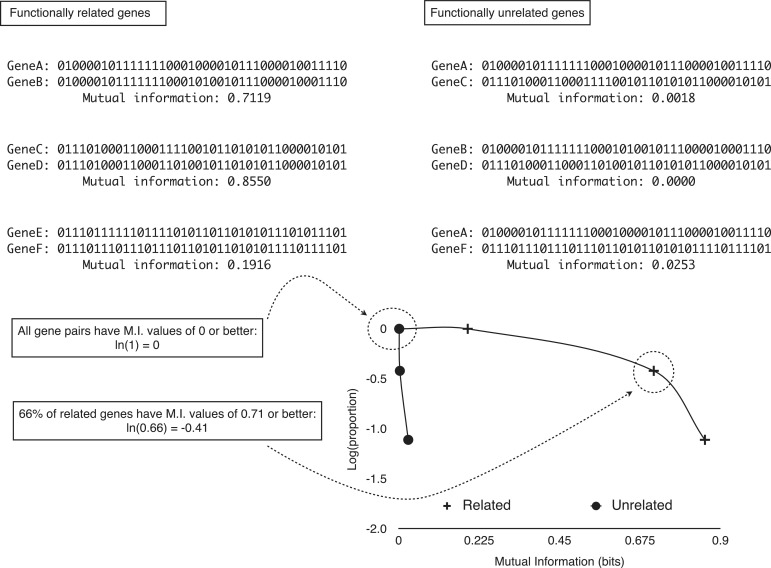
Figure 2.
Overview of the P-cubic method. Mutual information can be though of as a measure of how much two patterns coincide beyond what would be expected by chance. When the pattern for two proteins is almost the same, that is, the two proteins tend to co-occur across genomes, their mutual information is higher than when the patterns do not show co-occurrence. For example, despite the number of ‘1’ is approximately the same for genes A and C, their mutual information is low because their co-occurrences are more likely random. Genes whose products interact are expected to co-occur. However, this is not always the case, but the tendency is measurable as a higher proportion of co-occurring pairs than there would be among genes whose products are independent from each other (do not work together). A caveat of mutual information, however, is that if genes are abundant (or the opposite), then even though they might tend to co-occur, the patterns of co-occurrence might not result in high mutual information (genes E and F). As all gene pair sets have mutual information of 0 and better, all P-cubic curves start at ‘0’ [ln(1) = 0]. As the mutual information threshold increases, the proportion of gene pairs with that mutual information or better should decrease. More so for gene pairs that do not work together (less co-occurrence), than for genes whose products functionally interact (more co-occurrence).

