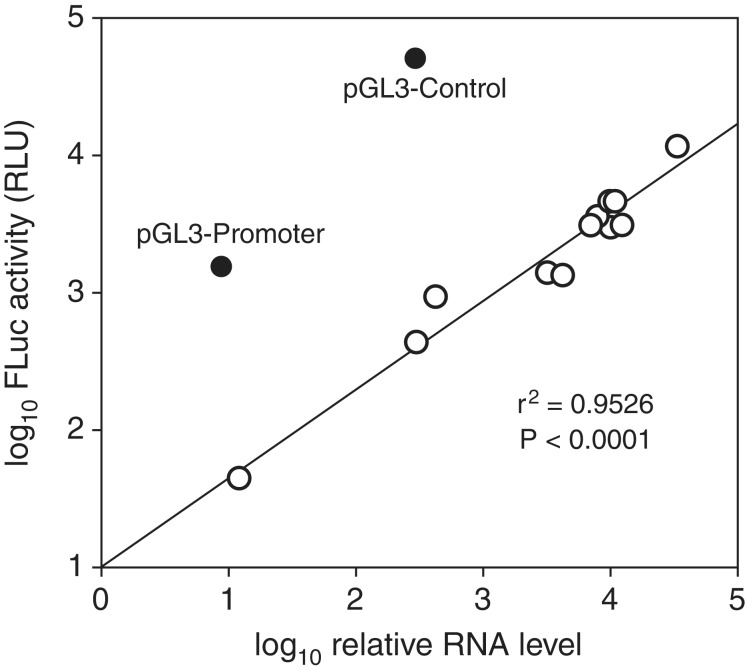
Figure 6.
Correlation between levels of spliced readthrough RNA and luciferase expression among the pRF and promoterless pGL3 plasmids tested in this study. Open circles represent the promoterless and promoter-containing pRF plasmids, pGL3-Basic, pGL3-Enhancer and the variants of these plasmids with 3′ ss-containing test inserts. The pRF plasmids containing either no insert or the spacer are not shown since they produced no detectable spliced readthrough RNA. The line represents the linear regression for the values obtained with these plasmids. The values for pGL3-Promoter and pGL3-Control, which were excluded from the regression analysis, are shown for comparison. Supplementary Table S1 provides the identities and values for all plasmids represented.

