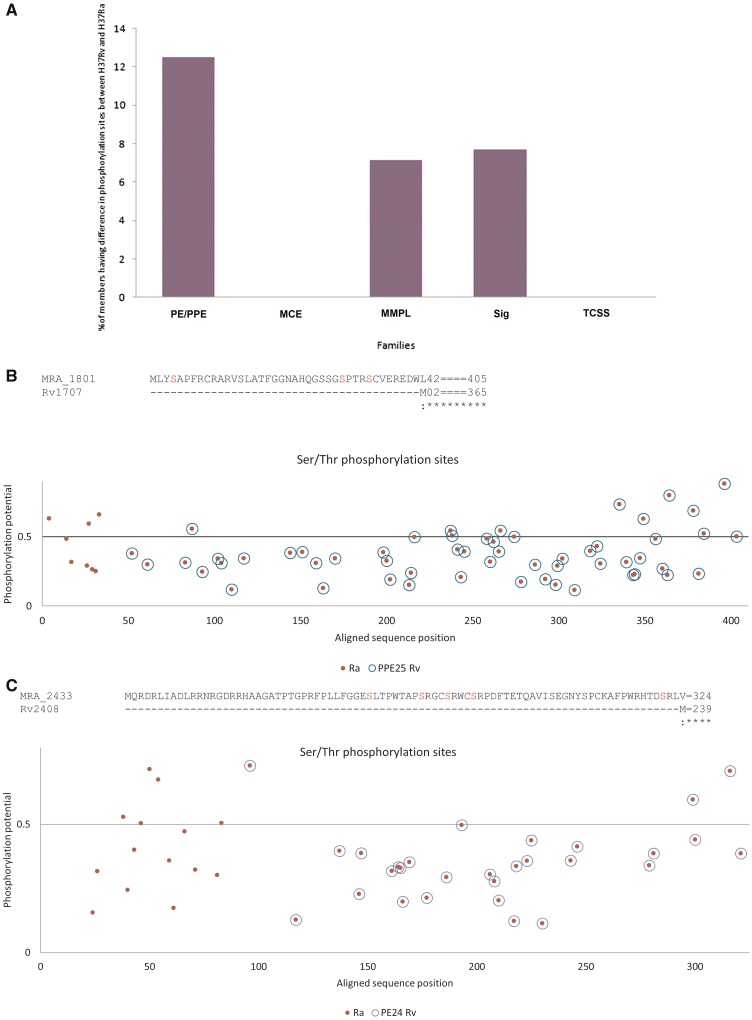
Figure 4.
Nucleotide variations between H37Rv and H37Ra result in gain or loss of serine/threonine phosphorylation sites. (A) The relative percentage of members of PE/PPE, mce, MmpL, Sigma, TCSS families exhibiting difference in phosphorylation sites between H37Rv and H37Ra is shown. (B, C) Gain of serine/threonine phosphorylation sites. The predictive phosphorylation site(s) in proteins is represented by blue circle (in the case of H37Rv) or red dots (in case of H37Ra). Overlap of blue and red circle indicates no gain or loss of phosphorylation sites in H37Rv and H37Ra proteins. Horizontal line represents the cutoff (threshold) above which it is considered as a putative phosphorylation site. The actual sequence of amino acids and the potential phosphorylation site (highlighted in red) is shown above the respective figures. N-terminal extension in MRA_1801 (B) or MRA_2433 (C) leads to gain of additional serine/threonine phosphorylation sites.

