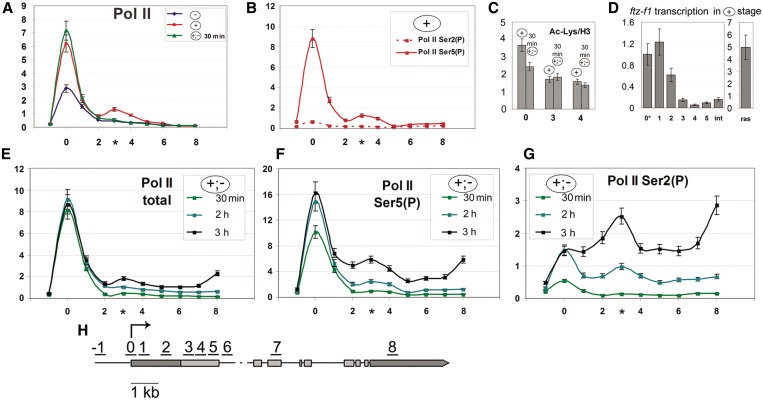
Figure 2.
Pol II pausing occurs at ∼1.5 kb downstream of the transcription start site, whether the ftz-f1 gene is in the repressed or transcriptionally active state. Here and in Figures 3–5, numerals on the x-axis correspond to those in the scheme (H) indicating the positions of probes used in RT–PCR (ChIP) or qPCR experiments; the asterisk indicates the position of second Pol II peak. Each distribution profile represents the average data of at least five experiments. (A) Distribution profile of Pol II along the ftz-f1 gene at different stages of induction—without ecdysone (–) shown in blue, at a high ecdysone titer (+) shown in red, and 30 min after ecdysone removal (+;–) shown in light green—as determined by ChIP with antibodies against total Pol II recognizing both its modified and unmodified forms. (B) Distribution profile of CTD Ser5- or Ser2-phosphorylated Pol II along the ftz-f1 gene in the repressed (+) state as determined by ChIP. (C) The levels of nucleosome acetylation at the promoter and downstream regions (indicated on the x-axis) of the ftz-f1 gene at the (+) and (+;–) 30-min stages as determined by ChIP. The level of acetylated histone is shown relative to the total H3 level. (D) The abortive transcription of ftz-f1 in the repressed state. The transcription level was measured at different points along the gene by quantitative RT–PCR and normalized with respect to the level of the corresponding DNA fragment (in genomic DNA) to estimate the efficiency of probe amplification. (E) Distribution profile of Pol II along the ftz-f1 gene at different time points [30 min (light green), 2 h (cyan) and 3 h (black)] after ecdysone removal as determined by ChIP with antibodies against total Pol II. (F) Distribution profile of Pol II Ser5-(P) along the ftz-f1 gene at different time points [30 min (light green), 2 h (cyan) and 3 h (black)] after ecdysone removal as determined by ChIP with antibodies against CTD Ser5-phosphorylated Pol II. (G) Distribution profile of Pol II Ser2-(P) along the ftz-f1 gene at different time points [30 min (light green), 2 h (cyan) and 3 h (black)] after ecdysone removal as determined by ChIP with antibodies against CTD Ser2-phosphorylated Pol II.

