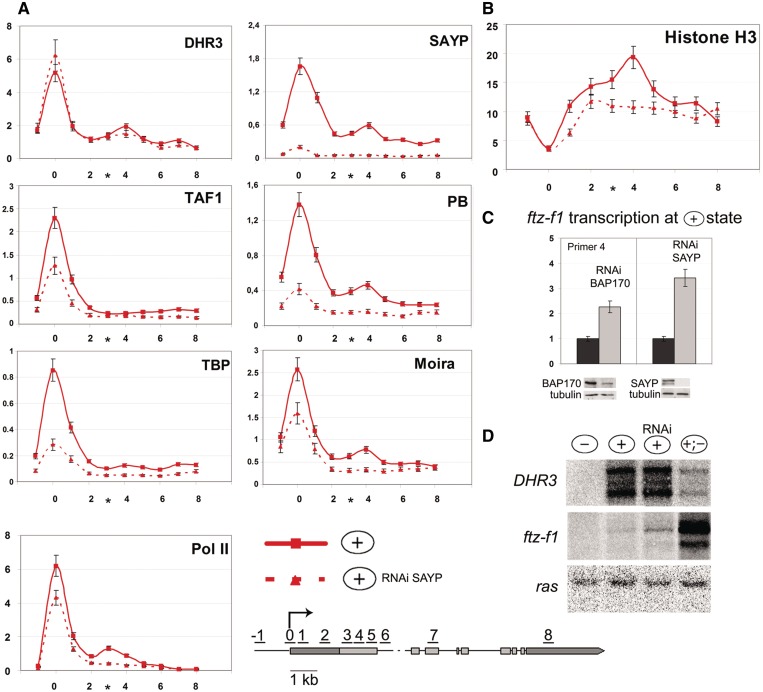
Figure 4.
In the repressed state of the ftz-f1 gene, SAYP and Brahma are essential for organization of nucleosome barrier and Pol II pausing. Distribution profiles determined by ChIP at the (+) stage against the background of SAYP RNAi knockdown (red dotted line) are compared with those in normal cells (red solid line) at the same stage (shown in Figure 3). Sham-treated cells were used as a control of RNAi in each experiment. (A) Distribution profiles of DHR3, SAYP, Brahma (PB and Moira) and TFIID (TAF1 and TBP) subunits, and Pol II along ftz-f1 after SAYP RNAi knockdown (red dotted line) compared with those in normal cells (red solid line) (Figure 3A). (B) Nucleosome distribution along the ftz-f1 gene after SAYP knockdown (red dotted line) compared with the H3 profile in normal cells (red solid line) (Figure 3B). (C) SAYP and BAP170 (Brahma subunit) knockdown leads to ftz-f1 transcription in the repressed (+) state. The levels of ftz-f1 transcription in the (+) state (dark bars) and upon its induction by RNAi knockdown of SAYP and BAP170 (light bars) were measured by qPCR and normalized relative to the level of ras transcription. The low level of ftz-f1 transcription in wild-type cells was taken as 1. The efficiency of knockdown was tested by western blot analysis. (D) Northern blot analysis of DHR3 and ftz-f1 transcription in S2 cells at different stages of ftz-f1 induction. At the (+) stage, RNA was prepared either from cells after SAYP RNAi knockdown or from sham-treated cells. Hybridization with the ras probe was used as a loading control.

