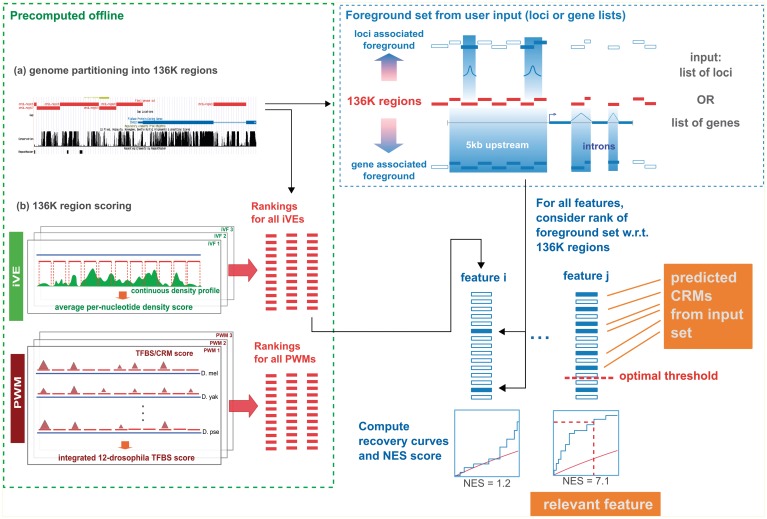
Figure 1.
Flowchart of i-cisTarget. The 136K regions are scored in batch (i.e. offline) with collections of PWMs and iVEs, yielding PWM and iVE rankings respectively. An input set of genes or genomic loci is mapped to the 136K set to obtain a set of foreground sequences. The enrichment of the foreground sequences is calculated in all rankings using recovery curves and statistics. Top ranking regions for enriched features represent candidate CRMs.

