Figure 2.

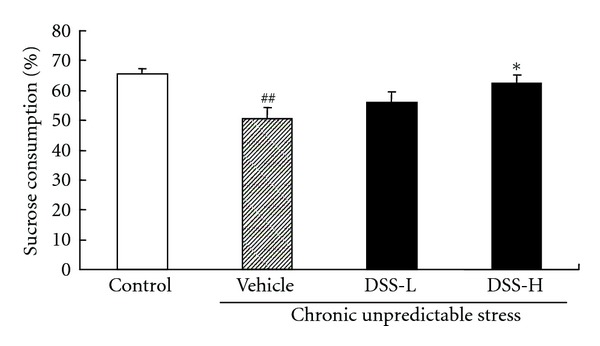
Effect of DSS treatment on the percentage of sucrose consumption in CUS-treated mice. Values given are the mean ± SEMs (n = 8). ## P < 0.01 as compared with the nonstressed control; *P < 0.05 as compared with the CUS-treated control.

Effect of DSS treatment on the percentage of sucrose consumption in CUS-treated mice. Values given are the mean ± SEMs (n = 8). ## P < 0.01 as compared with the nonstressed control; *P < 0.05 as compared with the CUS-treated control.