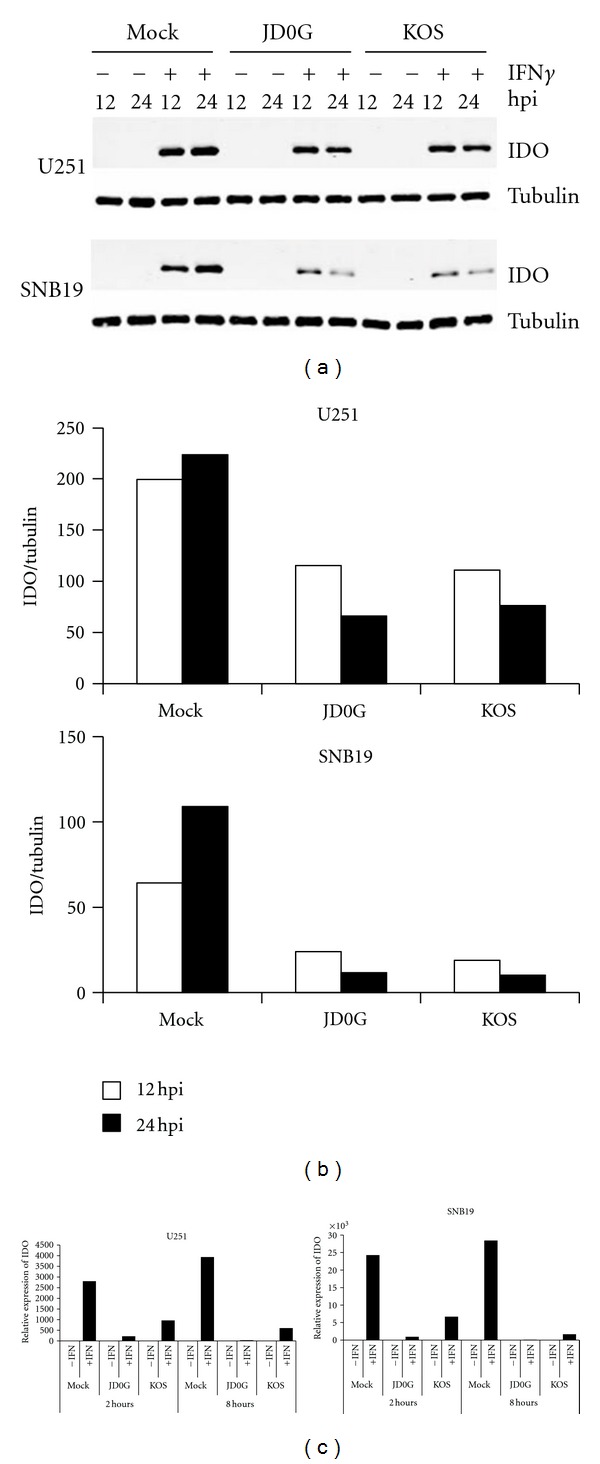
Figure 5.

Reduction in IFNγ-induced IDO expression following virus infection of glioblastoma cells. (a) The effect of virus infection on IFNγ-induced IDO protein levels in SNB19 cells (top) and U251 cells (bottom) was visualized by Western blot. Cells were treated with IFNγ or mock treated for 24 h prior to infection with either JD0G or KOS virus. At 12 and 24 hpi, cell lysates were analyzed by Western blot with antibodies against IDO protein (upper panels) or α-tubulin (lower panels). (b) IDO protein levels were quantified using the Odyssey Infrared Imaging System, and the relative amount of IDO protein (IDO/α-tubulin) in each sample is shown. Data are representative of three experiments using different time points. (c) The effect of virus infection on IDO mRNA levels in SNB19 and U251 cells was assessed by quantitative RT-PCR. Cells were treated with IFNγ or mock treated for 24 h prior to infection with either JD0G or KOS virus, and total cellular RNA was collected at 2 and 8 hpi. IDO mRNA levels for each sample were normalized to GAPDH levels and the fold change in IDO expression for each sample is shown relative to the untreated, mock-infected control.
