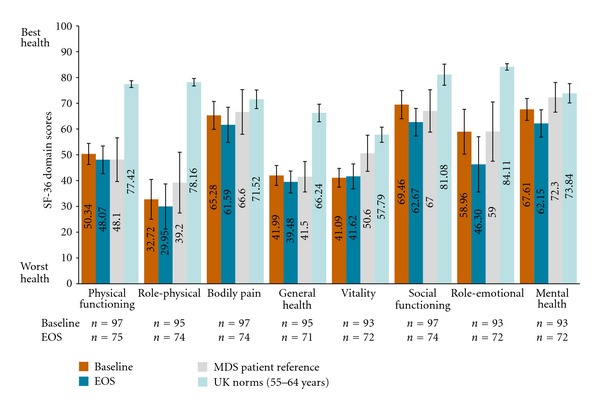
Figure 2.

Mean SF-36 domain scores for MDS population versus MDS and general population references at baseline and EOS. Data illustrated in the above figure are representative of the mean and 95% confidence interval estimates of the mean as calculated using the formula: 1.96 ∗ standard deviation . Transfusion-dependent MDS patient reference data reported by Jansen et al. [17]; UK norms from Jenkinson et al. [42] and direct email communications from Dr. Jenkinson on Oct 24, 2011 with age-specific norms.
