
Figure 2.
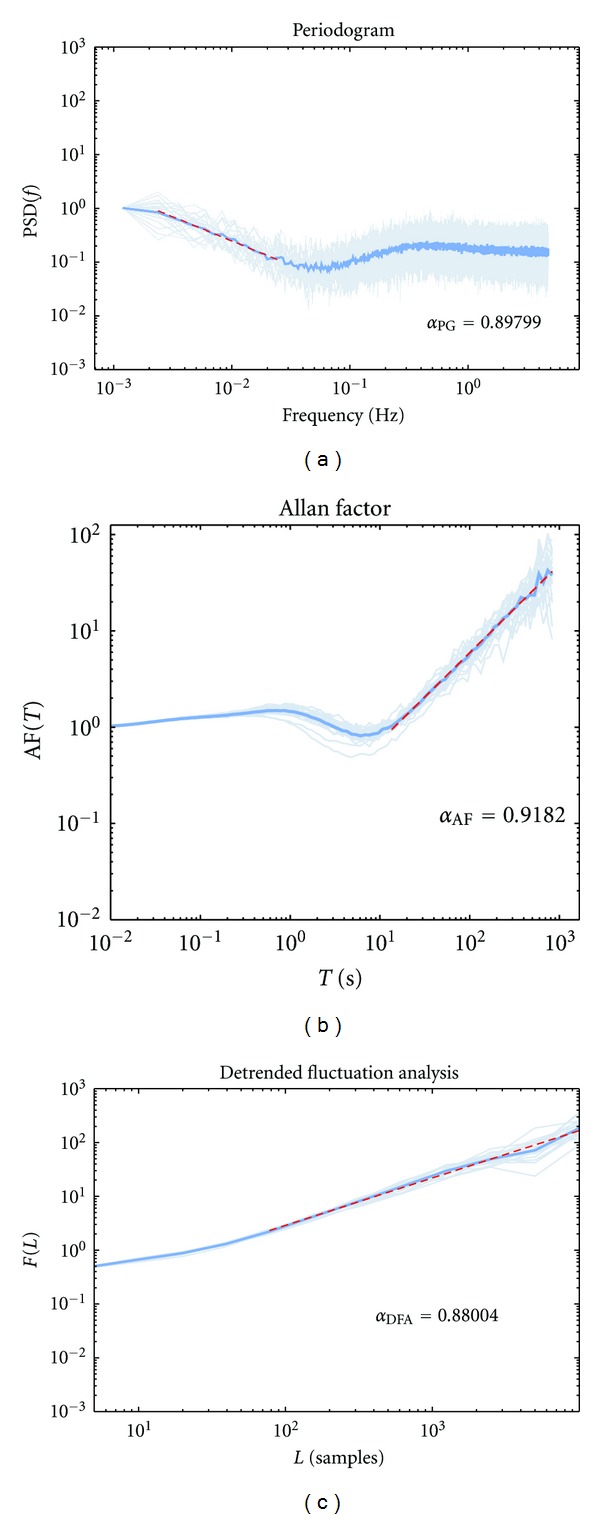
The three methods used for the quantification of the fractal exponent α on simulated release series (simulations with α = 1 and a f = 15%). (a) Periodogram (PG), (b) Allan factor (AF), and (d) detrended fluctuation analysis (DFA). Pale-blue lines represent single realizations (n = 20); thick blue lines represent the average of measures; red dashed lines are fittings in the selected range. Notice how the variation between different trials is quite limited.