Figure 1.

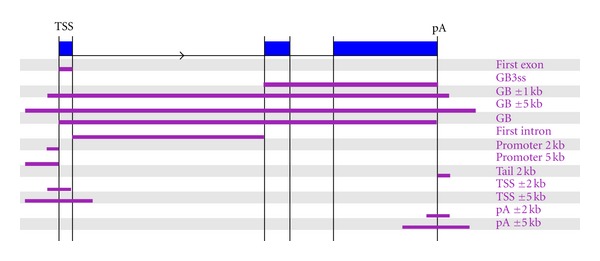
Graphical representation of the regions considered per transcript locus for the calculation of the different attributes. For detailed description of the regions see Table 3.

Graphical representation of the regions considered per transcript locus for the calculation of the different attributes. For detailed description of the regions see Table 3.