
Figure 2. Gating properties of WT and M1476I channels and the enlarged window current induced by the M1476I mutation.
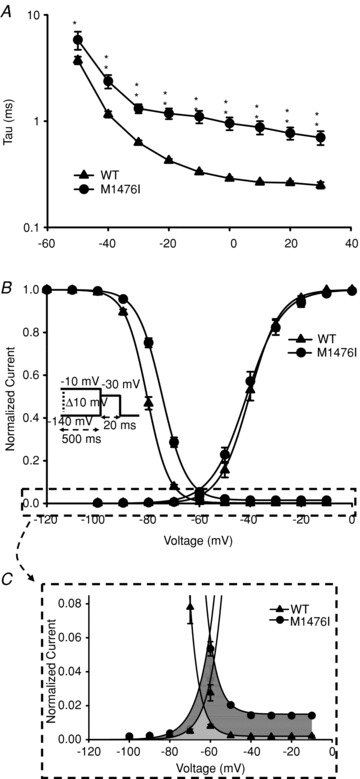
A, voltage dependence of inactivation time constants of the WT (▴, n = 14) and M1476I (•, n = 12) currents. The time course of the current decay elicited at depolarized voltages was best fitted to a single exponential function, and the resulting time constants were plotted versus voltage. B, voltage dependence of activation and inactivation of WT (▴) and M1476I (•) Na+ currents fitted with a Boltzmann equation. Activation curves were generated using the same protocol as shown in Fig. 1A. Steady-state inactivation was determined using a 20 ms test pulse to –30 mV after a 500 ms prepulse to potentials ranging from –140 mV to –10 mV (see inset under inactivation curves for the protocol). The V1/2 and kv values of the activation and inactivation curves are shown in Table 1. C shows a zoom-in of the enlarged window current (the sum of the dark grey and of the grey areas) induced by the M1476I mutation, that is the enlarged overlapping area between the voltage-dependent activation and inactivation curves. The grey area shows the window current induced by WT channels.