
Figure 1. Arterial blood parameters.
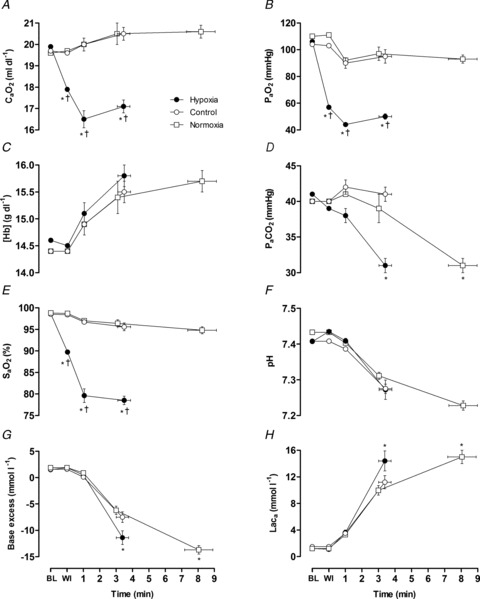
Arterial O2 content (A), O2 tension (B), haemoglobin concentration (C), CO2 tension (D), O2 saturation (E), pH (F), base excess (G) and lactate concentration (H). Values are plotted for pre-exercise baseline (BL), test gas wash-in (WI), for the duration of the shortest trial in that condition and extrapolated to the group mean exercise time. Data are means ± SEM for 6 participants. *P < 0.05 vs. control at the same time point; †P < 0.05 vs. normoxia at end-exercise.