
Figure 2. Cerebrovascular responses.
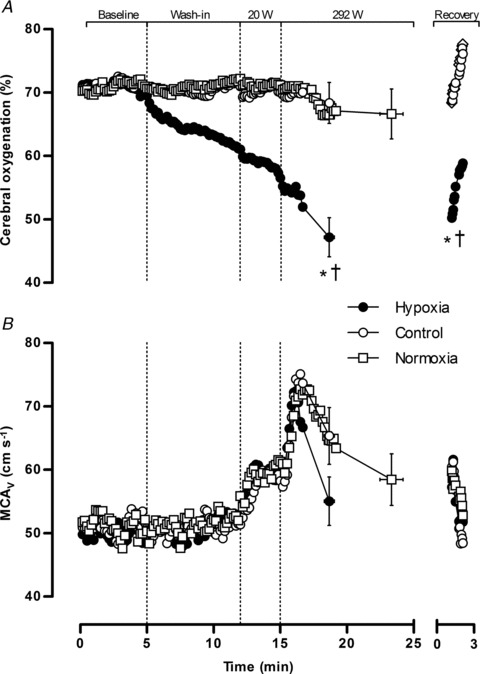
Cerebral oxygenation (A) and middle cerebral artery blood velocity (B). Data are averaged over 10 s epochs for pre-exercise baseline, test gas wash-in, unloaded cycling (20 W), severe constant-load exercise (292 W) and passive recovery. Values are plotted for the duration of the shortest trial in that condition and extrapolated to the group mean exercise time. Data are means ± SEM for 9 participants. *P < 0.05 vs. control at end-exercise or recovery; †P < 0.05 vs. normoxia at end-exercise or recovery.