
Figure 4. Whole-body O2 uptake and vastus lateralis integrated electromyographic activity.
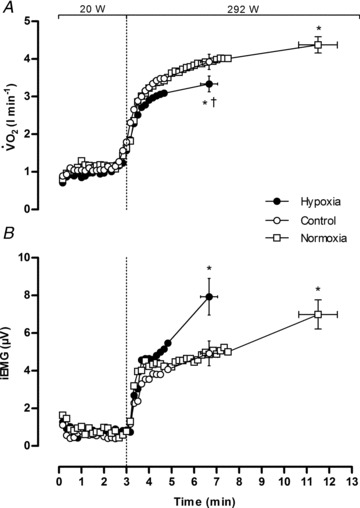
Data are averaged over 10 s epochs for unloaded cycling (20 W) and severe constant-load exercise (292 W). Values are plotted for the duration of the shortest trial in that condition and extrapolated to the group mean exercise time. Data are means ± SEM for 9 participants. *P < 0.05 vs. control at end-exercise; †P < 0.05 vs. normoxia at end-exercise.