
Figure 1.
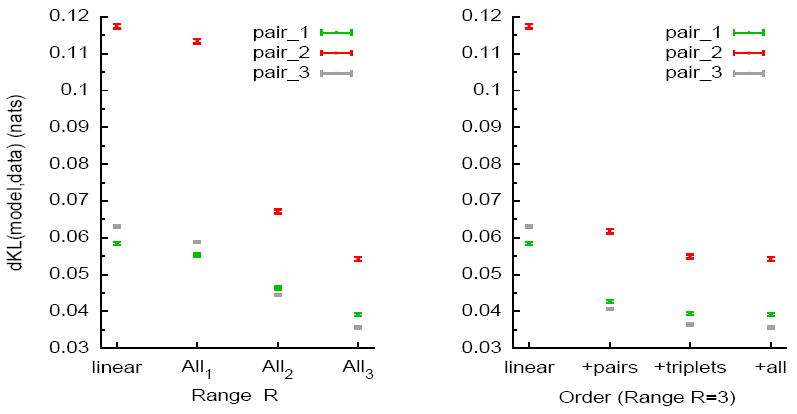
The KL divergence between empirical distribution computed from observed data and the distribution of the estimated model (different models are shown for several pairs, and error bars are included). “nats” means “natural units” (the KL divergence is divided by log 2). (Left) This figure depicts dKL for the Linear model and All-R from R = 1 to R = 3. Note that for a cell pair, All-1 model corresponds to the pairwise Ising model. (Right) The dKL divergence for models of range R = 3 are examined versus the role of pairs, then triplets and finally the full set of terms that constitute the All-3 model. The KL divergence of the linear model is included for comparison.