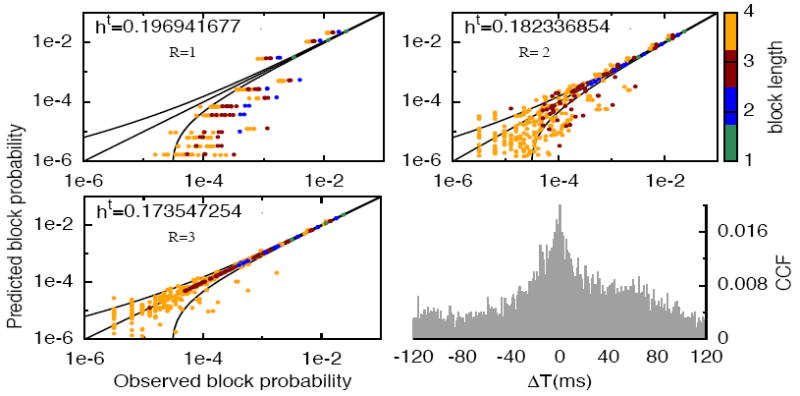
Figure 4.

The estimated block probability versus the observed block probability for all possible blocks from range 1 to 4 (coded by colors), one pair of neurons (pair 3) using All-R models R = 1,2,3 with data binned at 10 ms. We include the equality line y = x and the confidence bounds (black lines) for each model, corresponding to , σw being the standard deviation for each estimated probability given the total sample length T ~ 3 · 105. The cross-correlation function (CCF) of this pair is also depicted (bottom right).
