
Figure 2. Basic patterns and effect of walking speed.
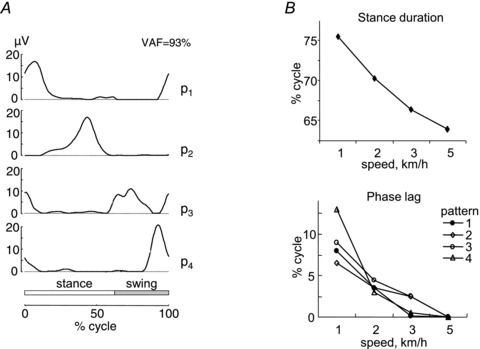
A, basic patterns obtained by non-negative matrix factorization of averaged (across steps) rectified EMG profiles of 16 unilateral leg muscles (see list in Fig. 3A) in 10 walking subjects. Patterns are plotted versus normalized gait cycle. VAF cumulative variance accounted for by all patterns. B, upper plot: changes in the relative duration of the stance phase with speed. Lower plot: phase lag required to provide the best fit between each pattern and the pattern determined from the 5 km h−1 data. B is modified from Ivanenko et al. 2004.