
Figure 8. Timeline for assembly of auditory circuits.
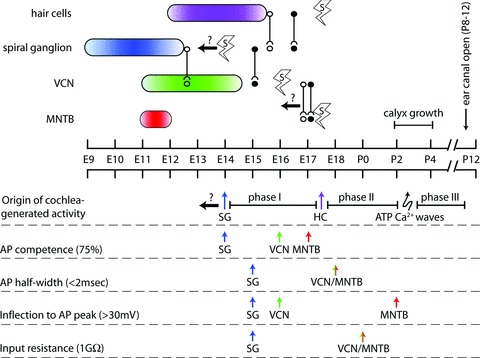
Upper timeline, birthdates of constituent cell groups indicated by coloured ovals. Age of initial connectivity between auditory stations is depicted by lines with open symbols for anatomical proximity (axons have entered postsynaptic cell group), and lines with filled symbols for initial functional communication. Earliest age at which neurons and hair cells generate spontaneous APs is indicated with lightning bolt symbol. Left-facing arrows with question marks denote events that may occur at earlier ages. Lower timeline, three phases of cochlea-generated activity are proposed: phase I from time at which SGCs generate spontaneous activity to time at which hair cells can drive SGC activity, phase II from hair cell-driven SGC activity to onset of ATP generated Ca2+ waves, phase III from onset of ATP Ca2+ waves to onset of sensitivity to airborne sound. Also depicted are temporal sequences comparing auditory stations across measures of AP competence, input resistance, AP breadth and AP height. In general, SGCs develop ahead of VCN and MNTB neurons.