
Figure 2. Anatomy of trigeminal interneurons (tINs) and responses to head skin stimulation.
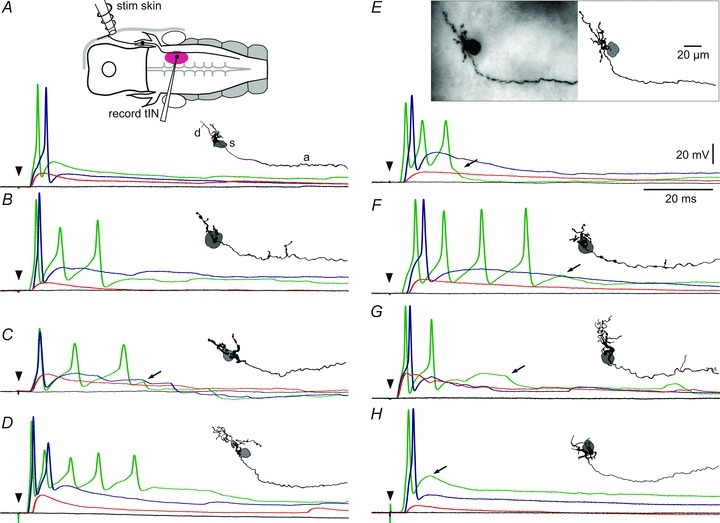
A, diagram of the preparation viewed dorsally showing the head skin stimulating electrode (stim skin) on the right side, a trigeminal sensory neuron projecting into the brain and the area where tINs were recorded (purple ellipse; record tIN). Traces show tIN responses to skin stimuli (arrowhead) of increasing strength from black = no response, red = EPSP alone, blue = spike, to green = multiple or earlier spikes. Inset shows the morphology of the tIN viewed from the inside of the right side of the hindbrain (rostral left) with dendrites (d) and descending axon (a). The position of the soma (s) is shown in grey. B–H, further examples to show the range of tIN anatomy and responses; E includes a photograph of the filled tIN. Arrows in C, E, F, G and H mark IPSPs (see text).