
Figure 3. tIN soma positions and axon lengths.
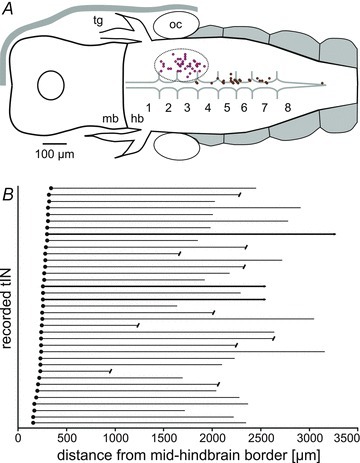
A, positions of the somata of recorded tINs (in dotted outline in rhombomeres 2–4) and dINs (close to midline in rhombomeres 3–7). B, individual tIN soma positions (filled circles) and descending axons. Some axons were broken (capped lines) or faded out but 3 were completely filled (bold lines).