
Figure 4. Effects of NBQX on EPSPs in tINs evoked by head skin stimulation.
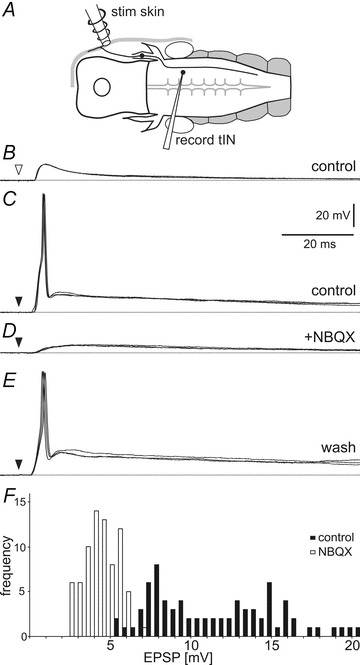
A, diagram of the preparation in dorsal view showing the position of the stimulating and recording electrodes. B, a current pulse to the head skin (open arrowhead) leads to a tIN EPSP with a short delay. C, a stronger stimulus (black arrowhead) leads to spiking. D, NBQX perfusion (50 μm) blocks the spike and reveals a smaller slow rise and fall EPSP. E, after 20 min washing, the same stimulus evokes spiking again. Overlay of three traces each, dotted lines show resting membrane potential. F, histogram showing the tIN EPSP amplitude before (black bars) and after NBQX perfusion (open bars). Data are from 5 EPSPs from 15 tINs for each treatment, bin size: 0.5 mV.