
Figure 6. Neuronal properties of tINs.
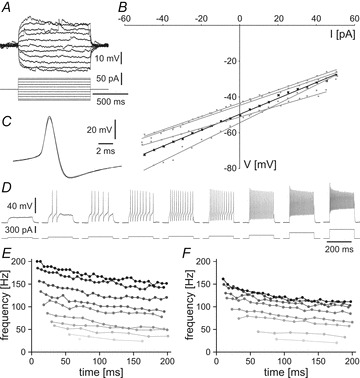
A, response to injected current: Membrane potential change of a typical tIN (Rin of 372 MΩ) in response to applied depolarising and hyperpolarising current. B, input resistance: plot showing the current–voltage relationship for the cell shown in A (black trace) and four other tINs (Rin from 312 to 529 MΩ) around the resting membrane potential. C, spike shape: tINs have narrow spikes with clear afterhyperpolarisation as shown in an overlay of three traces of a tIN spike evoked during current injection. D, firing response: a tIN shows non-adapting, repetitive firing (up to 200 Hz) to depolarising current injections with increasing intensity. E and F, plots showing that the instantaneous firing frequency of two tINs increases as a function of the injected current (from 40 to 300 pA, grey to black), staying relatively constant within a burst. E is same neuron as D.