
Figure 8. Synaptic connections from tINs to dINs and their pharmacology.
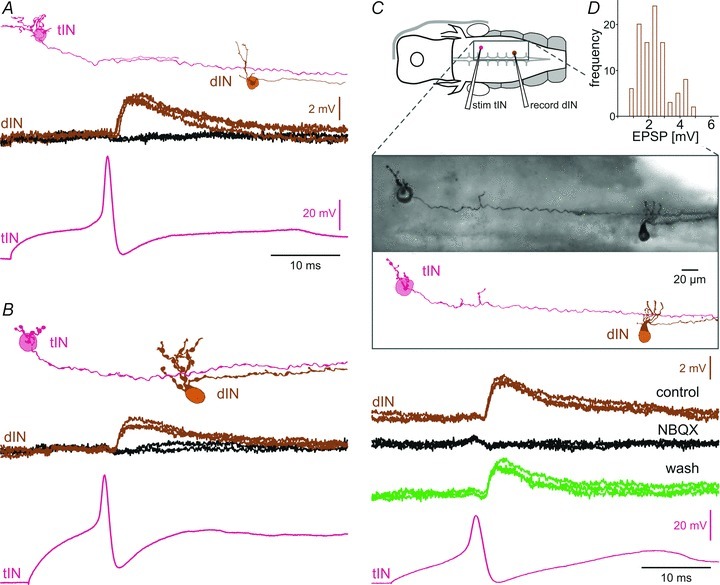
A–C, examples of tIN/dIN paired recordings demonstrating their excitatory connection using the set-up shown in the diagram in C. Filled neurons viewed from the inside of the right hindbrain (rostral to the left) show tINs with descending axons and possible connections to dendrites of dINs. Current-induced spikes in tINs produce a small EPSP in dINs with a probability of about 50%. C, the control dIN EPSP is blocked by NBQX (50 μm) and restored after 20 min washing. Inset shows a photographic image of this pair. D, histogram showing the amplitudes of dIN EPSPs (data are from 10 EPSPs for each of 10 tIN/dIN pairs, bin size: 0.5 mV).