
Figure 10. Modelling summation of EPSPs from the tIN population in dINs.
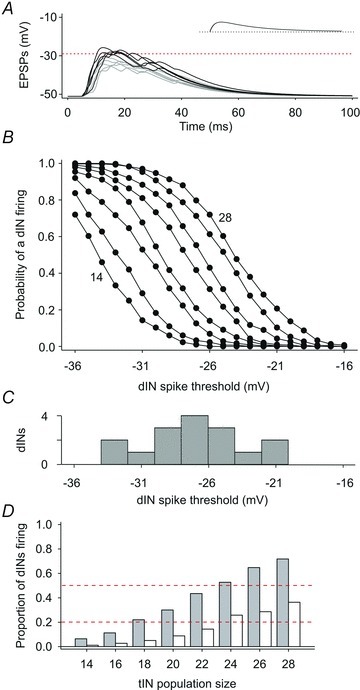
A, ten examples of summated model EPSPs from a population of 20 tINs. Black trajectories are examples crossing a spike threshold (dotted line) set in this example at −29 mV. Grey trajectories do not cross threshold but still provide strong depolarisation. Inset shows an individual EPSP (same time scale). B, the probability of a dIN firing ( = summated EPSP depolarising dIN above threshold) for thresholds between −16 and −36 mV; lines connect estimates for tIN populations of 14, 16, 18 … 28 neurons (order indicated). Each point is from 300 model runs. C, distribution of measured dIN spike thresholds (N = 16 neurons; from Li et al. 2009). D, estimated proportion of dINs firing as a result of summation of tIN EPSPs; dashed lines indicate 0.2 and 0.5 for guidance. Grey bars are based on observed tIN firing (1–5 spikes each); open bars show reduced dIN firing when tINs fire only a single spike each.