
Figure 12. Initiation of swimming after head skin stimulation.
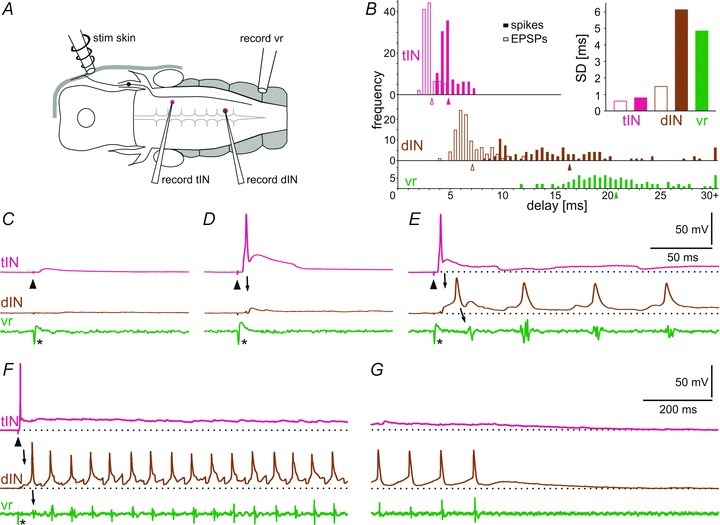
A, diagram showing the position of the stimulation and recording electrodes. B, distribution of the response latencies from head skin stimulation to EPSPs (open bars) and spikes (filled bars) in tINs and dINs and start of swimming in vr. Note in the inset graph the much smaller standard deviations for latencies of EPSPs in tINs, spikes and EPSPs in dINs compared to the dIN spikes that are larger and similar to the onset of swimming. Data are from 10 EPSPs and spikes for each of 10 tINs, dINs and vr starts. Means are indicated by arrowheads (bin size: 0.5 ms). C, a weak electrical stimulus (arrowhead), insufficient to initiate swimming, leads to a short latency EPSP in the tIN. D, a stronger stimulus leads to a spike in the tIN followed by an EPSP in the dIN (arrow). E, the same strength stimulus can also lead to a spike in the tIN and dIN (arrow), followed by swimming recorded in the ventral root (vr, arrow) on the same side when the dIN fires once on each cycle. F and G, a similar response to E but in a different animal. Beginning (F) and end (G) of the swimming sequence shows the clear depolarisation from resting membrane potential (dotted line) of both tIN and dIN during and after fictive swimming. Asterisks mark the stimulus artefact.