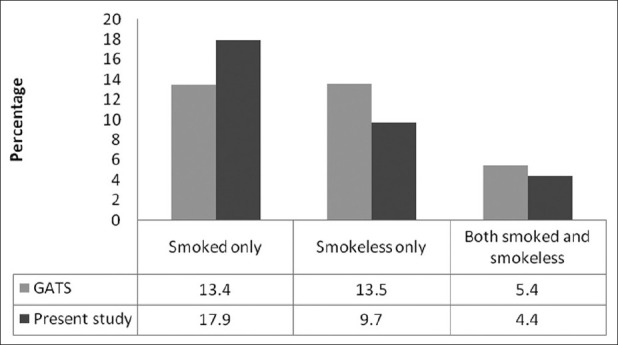
Figure 1.

Pattern of tobacco use as compared to GATS (2009–2010). The numbers in the table represent percentage. The pattern of tobacco use in the present study was almost the same as that of GATS data for the state of Rajasthan except a slightly higher score seen in “smoked only” fraction. Please note that in our study, we collected data about tobacco users only. Therefore, percentage of non-users (not shown in the figure) was kept at the same level as that of GATS data for comparison
