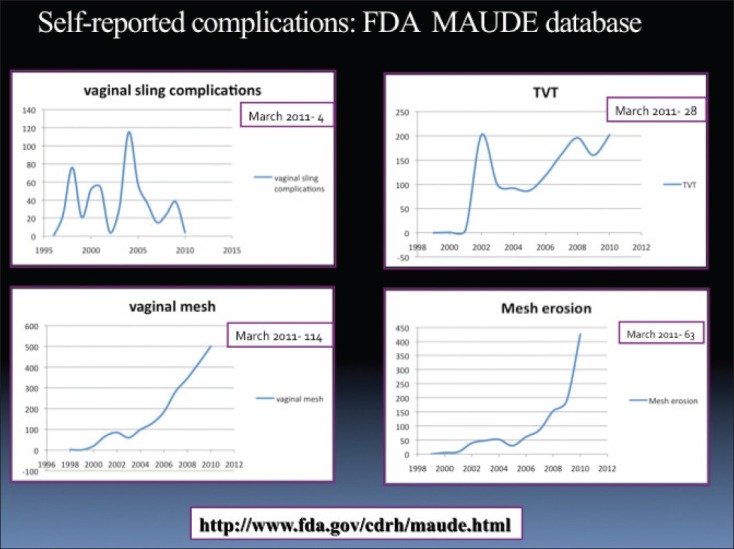
Figure 5.

Incidence of complications reported under various search criteria till March 2011 in the MAUDE database. The incidence till the year 2010 is plotted in the graph; while the number of cases reported in the present year till March 2011 is reflected with in number on right upper quadrant of each graph
