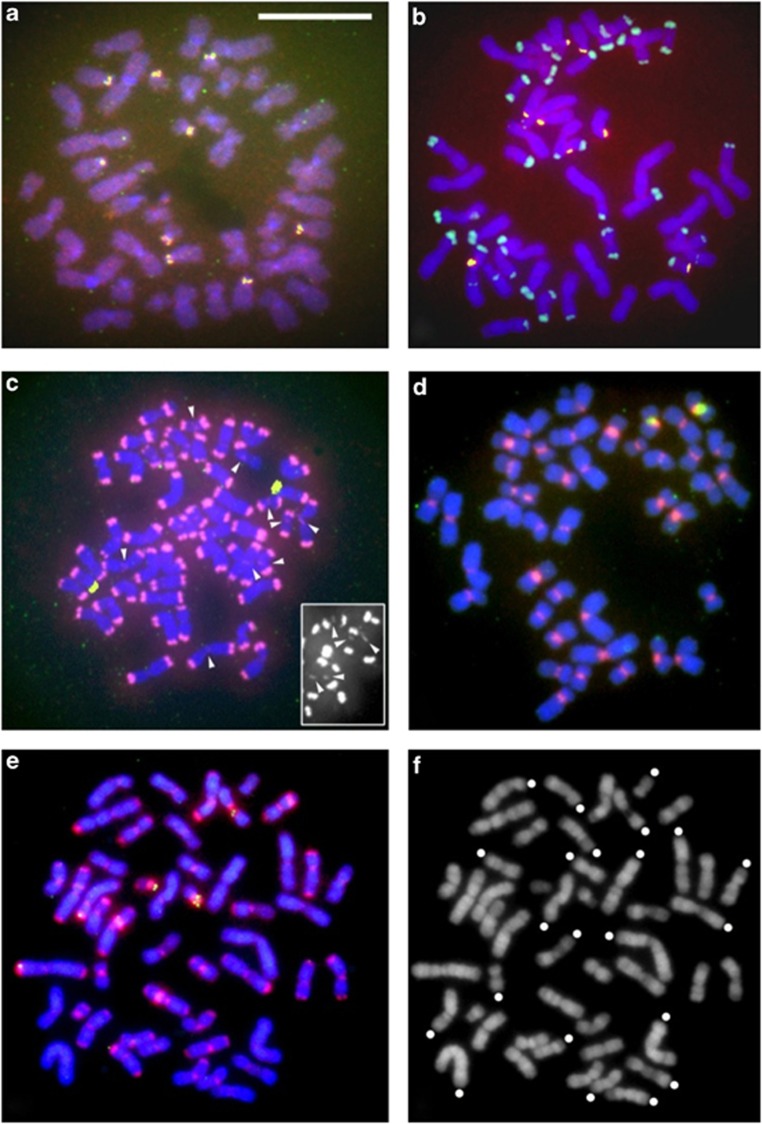
Figure 6.
FISH analysis of chromosomes for locations of the repeat sequences. Three probes were used in single hybridization assays: StSat repeats (green), SiaRep (red) and a clone of human 18S ribosomal DNA (yellow; see Hirai et al., 1999). The last probe served as a positive control for hybridization reactions. (a) Human; (b) chimpanzee; (c) SSY; (d) HAG and (e) HLA/NLE hybrid. The bar in (a) represents 10 μm. Panel (f) is not a photograph of fluorescence detection but a DAPI banding pattern of the chromosome spread used for panel (e). This treatment yields G band-like bands, and enables, based on the chromosome shape and banding patterns, identification of the origin (HLA or NLE) and the chromosome number (Hirai et al., 2007). Chromosomes originating from the HLA parent are marked with white dots. Chromosomes without dots are those derived from the NLE parent. Scanning of chromosome spreads for (a–e) using an image analyzer was first conducted at its default settings that automatically achieved the highest signal-to-noise ratio. Photographs in (a, b, d and e) were those obtained with these settings. We then scanned the same spreads again at a manual setting to attain higher sensitivity (and a larger amount of noise at the same time). The siamang sample exhibited signals only in the telomere regions in the first scan, but the second scan detected additional faint signals in centromere regions. Panel (c) is a photograph obtained in this second scan. No additional signals were found in the other four samples. In (c), some, but not all, relatively strong signals in the centromere regions are indicated by arrowheads. The black-and-white photograph overlaid in (c) was produced by a further scan of the right part of the chromosome spread for the luminance level due only to biotin-rhodamin (labeling substance for the SiaRep probe).

