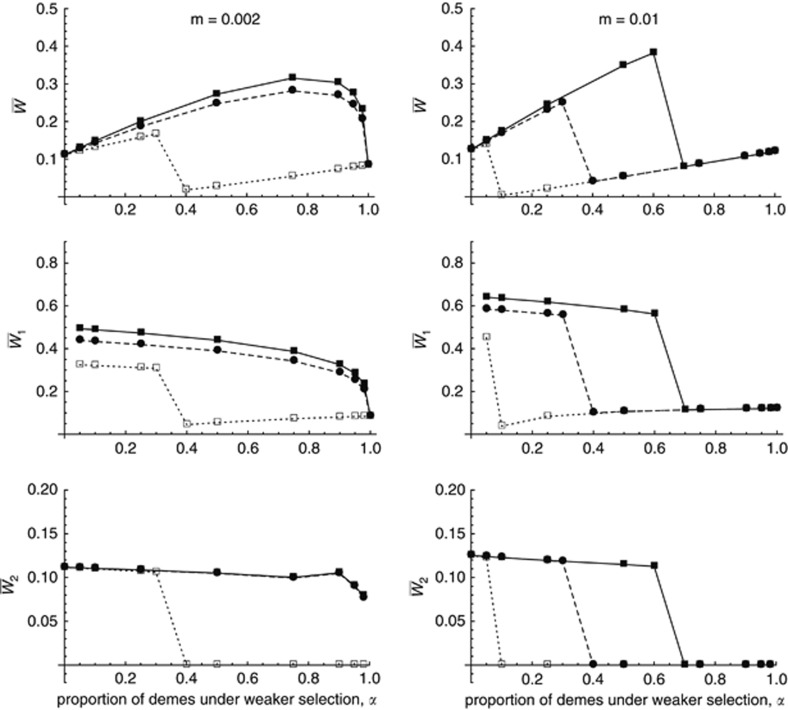
Figure 4.
Mean fitness in the whole metapopulation (top rows) and in demes under weaker (middle rows) and stronger selection (bottom rows), as a function of α (the proportion of demes under weaker selection), without population regulation before migration. Left column: m=0.002; right column: m=0.01. The different curves correspond to different values of η (the fitness of mutant-free individuals in demes under harsh selection versus the fitness of the same individuals in demes under weaker selection): filled squares, solid lines: η=1; filled circles, dashed lines: η=0.5; empty squares, dotted lines: η=0.1. Other parameters are as in Figure 1.

