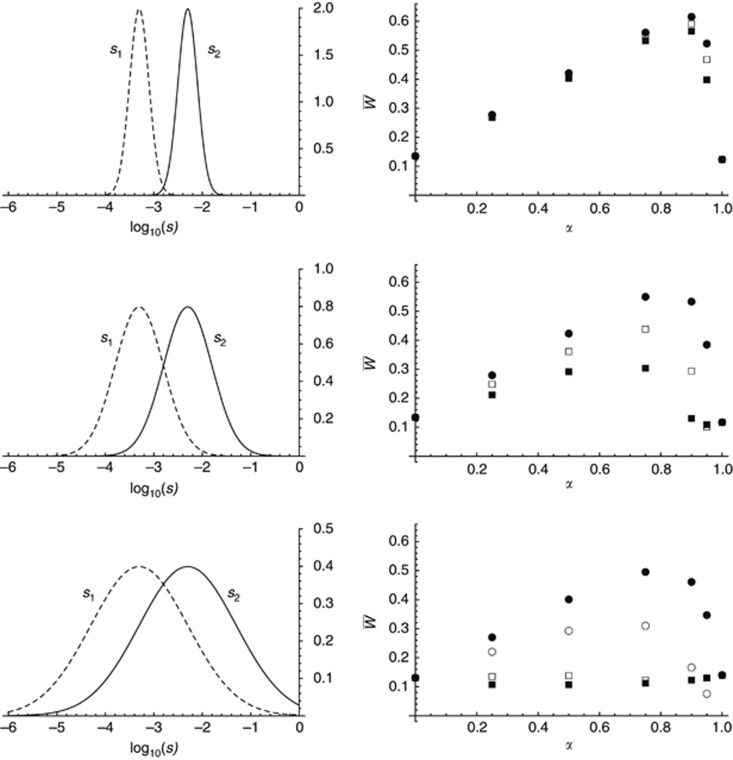
Figure 5.
Results from the second program (distributions of mutational effects). Left figures show the marginal distributions of s1 and s2 (which now measure effects of mutations in the heterozygous state); right figures show mean fitness as a function of α, for different values of the correlation coefficient ρ between s1 and s2: ρ=0 (filled squares), 0.5 (empty squares), 0.8 (empty circles, bottom figure only) and 1 (filled circles). The mean mutational effects are fixed to 0.0005 in environment 1 and 0.005 in environment 2. Other parameters are n=100, N=500, m=0.05, K (number of chromosomes) =10, R/K, U/K (chromosome map length and mutation rate per chromosome) =0.1, nL (number of loci) =105. SD of the distributions of log10(s1), log10(s2): 0.2 (top), 0.5 (middle), 1 (bottom).

