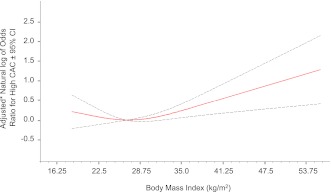
Figure 2.
Multivariable-adjusted natural log of the odds ratio for high CAC ± 95% CI in relation to BMI as assessed by a spline regression model. The reference for the odds ratios is that associated with the median BMI value. For BMI values greater than the median, the log of odds ratios compared with the median value increases linearly as BMI increases; but BMI values less than the median also tend to have higher odds ratios compared with the median value, indicating some nonlinearity in the lower BMI range. *Data are adjusted for fasting glucose, age, sex, systolic blood pressure, total-to-HDL cholesterol ratio, smoking status, and lipid-lowering and antihypertension therapy. High CAC is defined as the 90th percentile value for their age- and sex-specific strata. (A high-quality color representation of this figure is available in the online issue.)

