
Figure 3.
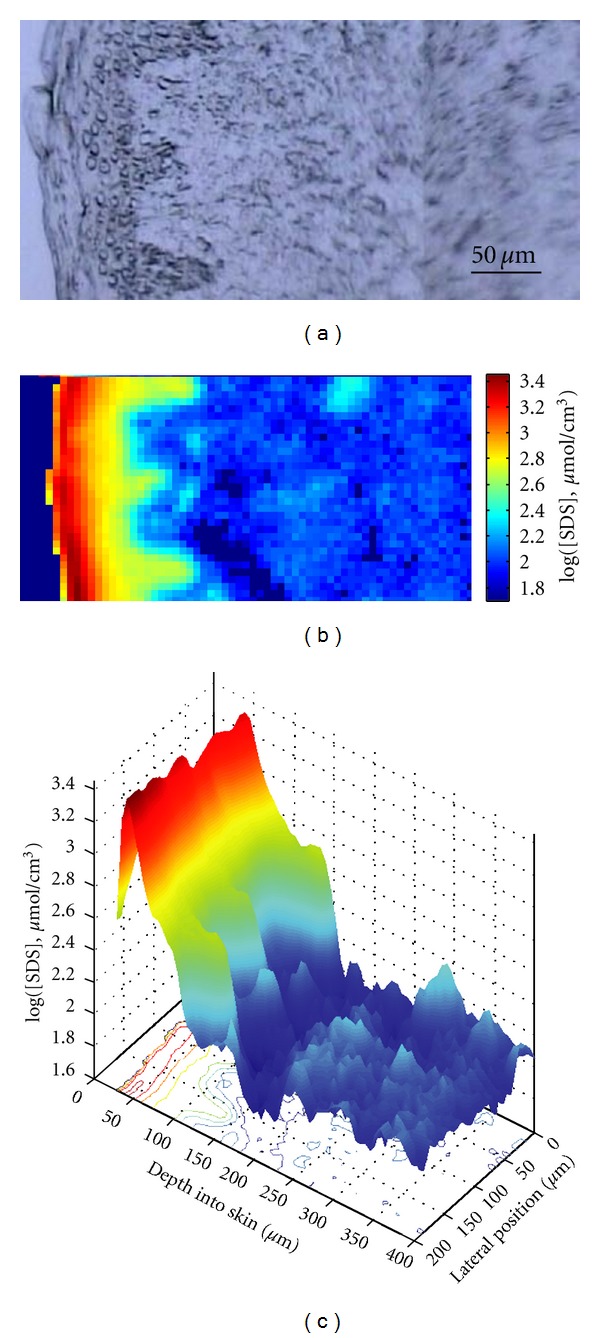
(a) Visible light microscopic image of human skin cross-section, distribution of SDS concentration in the same skin section following 40 h topical SDS treatment at 34°C, (b) shown as an IR image map, and (c) shown as a 2D depth profile.
Official websites use .gov
A
.gov website belongs to an official
government organization in the United States.
Secure .gov websites use HTTPS
A lock (
) or https:// means you've safely
connected to the .gov website. Share sensitive
information only on official, secure websites.
(a) Visible light microscopic image of human skin cross-section, distribution of SDS concentration in the same skin section following 40 h topical SDS treatment at 34°C, (b) shown as an IR image map, and (c) shown as a 2D depth profile.