
Figure 4.
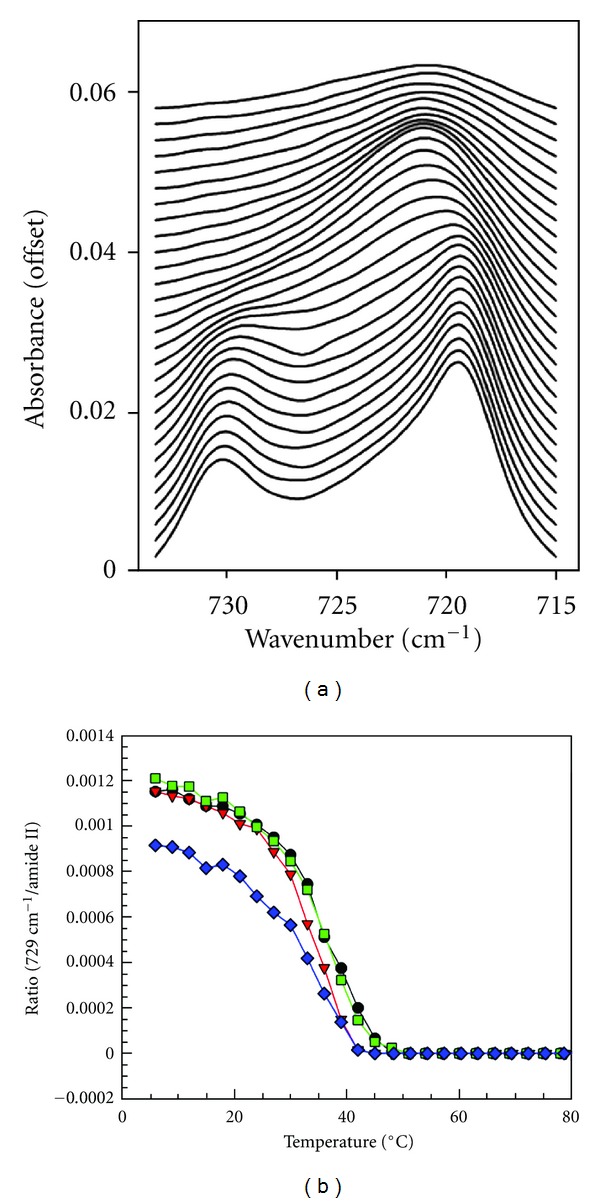
(a) CH2 rocking band contour progression with temperature increase from 6°C (bottom) to 90°C (top) in 3°C increments a in an isolated human SC control sample; (b) integrated peak area of 729 cm−1 rocking band normalized by protein Amide II peak area as a function of temperature for 2 h control (circles line), 2 h SDS-d25 (down-pointing triangles line), 6 h control (square line), and 6 h SDS-d25 (rhombuses line) isolated human SC samples.