
Figure 6.
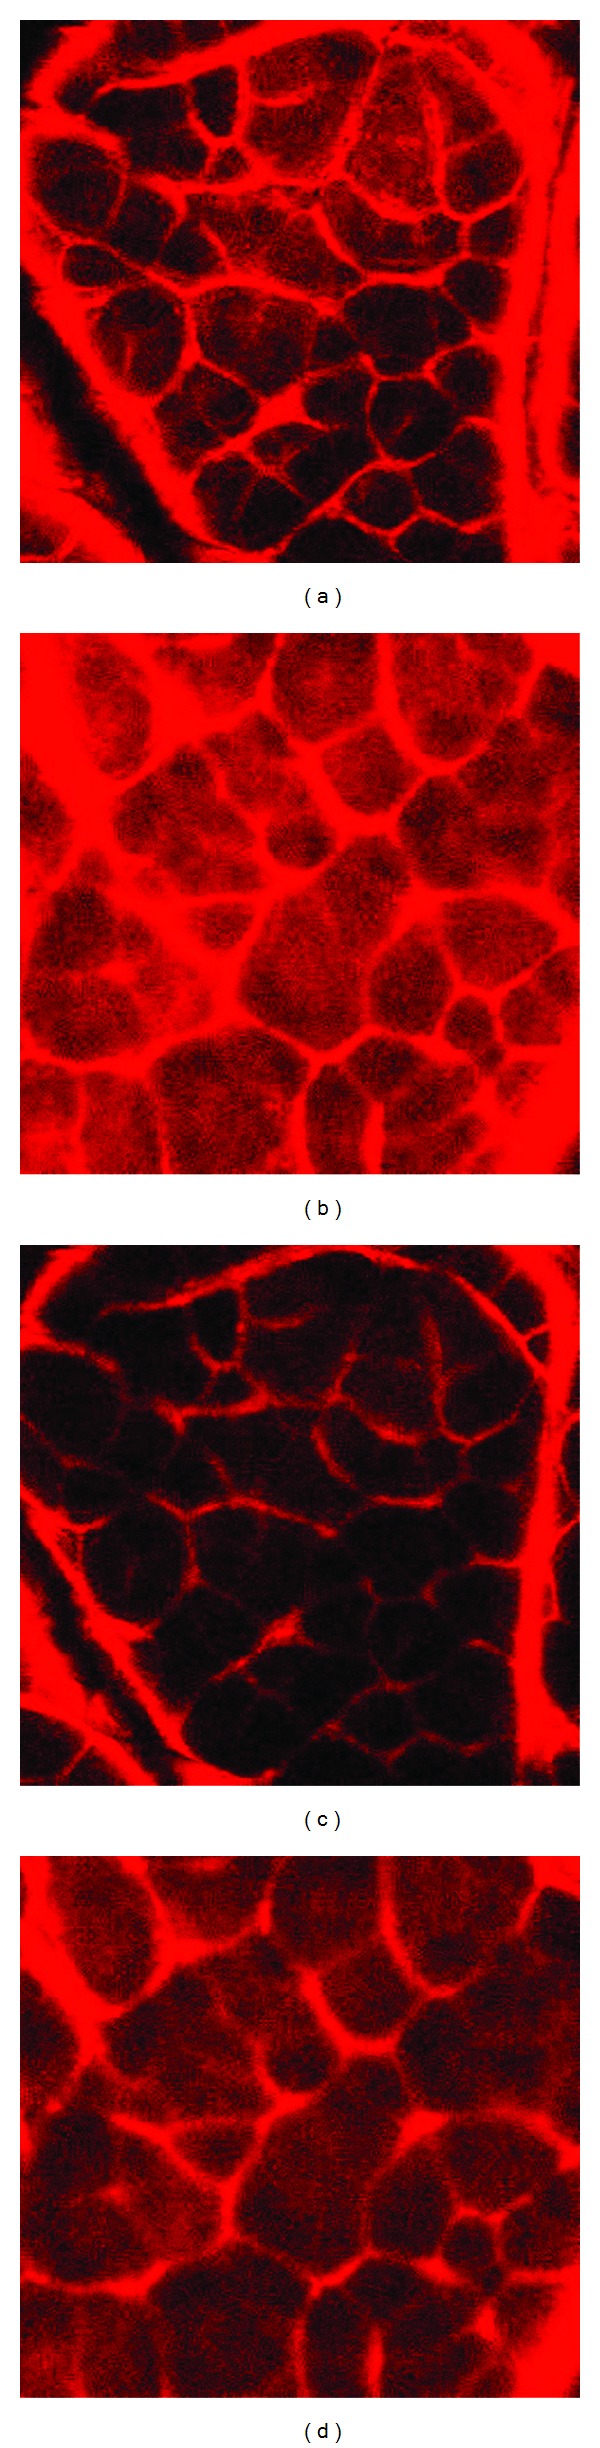
2-photon fluorescent microscopy images showing skin barrier condition after treatment with NUG facial cleanser, with HMP (a and c) compared to CGSC (b and d) at a depth into the SC of 2 μm (upper row; a and b) and 20 μm (lower row; c and d). The limited dye penetration (lower intensity) indicates a more intact barrier, while more dye penetration indicates a weaker barrier.